This morning we released another great set of enhancements to Windows Azure. Today’s new capabilities include:
- BizTalk Services: General Availability Release
- Traffic Manager: General Availability Release
- Active Directory: General Availability Release of Application Access Support
- Mobile Services: Active Directory Support, Xamarin support for iOS and Android with C#, Optimistic concurrency
- Notification Hubs: Price Reduction + Debug Send Support
- Web Sites: Diagnostics Support for Automatic Logging to Blob Storage
- Storage: Support for alerting based on storage metrics
- Monitoring: Preview release of Windows Azure Monitoring Service Library
All of these improvements are now available to use immediately (note that some features are still in preview). Below are more details about them:
BizTalk Services: General Availability Release
I’m excited to announce the general availability release of Windows Azure Biz Talk Services. This release is now live in production, backed by an enterprise SLA, supported by Microsoft Support, and is ready to use for production scenarios.
Windows Azure BizTalk Services enables powerful business scenarios like supply chain and cloud-based electronic data interchange and enterprise application integration, all with a familiar toolset and enterprise grade reliability. It provides built-in support for managing EDI relationships between partners, as well as setting up EAI bridges with on-premises assets – including built-in support for integrating with on-premises SAP, SQL Server, Oracle and Siebel systems. You can also optionally integrate Windows Azure BizTalk Services with on-premises BizTalk Server deployments – enabling powerful hybrid enterprise solutions.
Creating a BizTalk Service
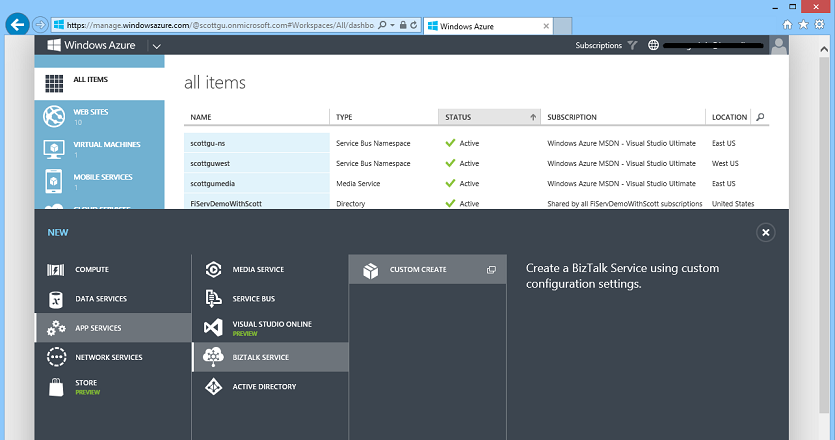
Creating a new BizTalk Service is easy – simply choose New->App Services->BizTalk Service to create a new BizTalk Service instance:
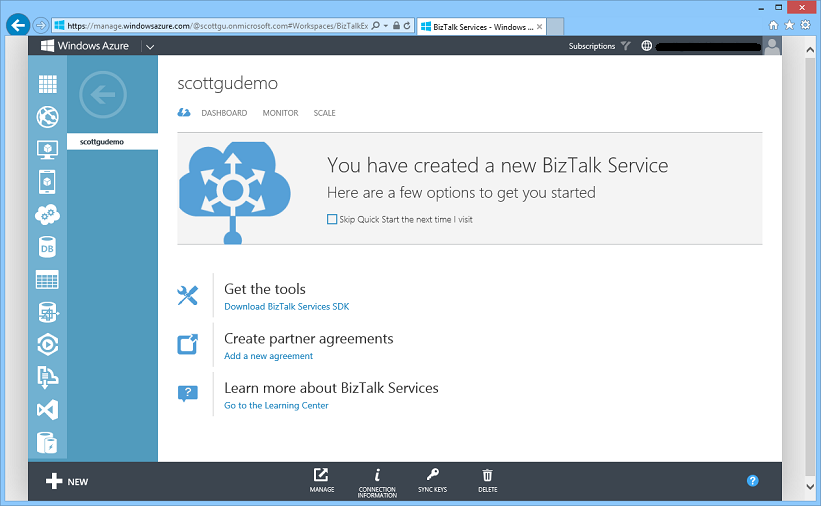
Windows Azure will then provision a new high-availability BizTalk instance for you to use:
Each BizTalk Service instance runs in a dedicated per tenant environment. Once provisioned you can use it to integrate your business better with your supply chain, enable EDI interactions with partners, and extend your on-premises systems to the cloud to facilitate EAI integration.
Changes between Preview and GA
The team has been working extremely hard in preparing Windows Azure BizTalk Services for General Availability. In addition to finalizing the quality, we also made a number of feature improvements to address customer feedback during the preview. These improvements include:
- B2B and EDI capabilities are now available even in the Basic and Standard tiers (in the preview they were only in the Premium tier)
- Significantly simplified provisioning process – ACS namespace and self-signed certificates are now automatically created for you
- Support for worldwide deployment in Windows Azure regions
- Multiple authentication IDs & multiple deployments are now supported in the BizTalk portal.
- BackUp-Restore is now supported to enable Business Continuity
If you are already using BizTalk Services in preview, you will be transitioned automatically to the GA service and new pricing will take effect on January 1, 2014.
Getting Started
Read this article to get started with provisioning your first BizTalk Service. BizTalk Services supports a Developer Tier that enables you to do full development and testing of your EDI and EAI workloads at a very inexpensive rate. To learn more about the services and new pricing, read the BizTalk Services documentation.
Traffic Manager: General Availability Release
I’m excited to announce that Windows Azure Traffic Manager is also now generally available. This release is now live in production, backed by an enterprise SLA, supported by Microsoft Support, and is ready to use for production scenarios.
Windows Azure Traffic Manager allows you to control the distribution of user traffic to applications that you host within Windows Azure. Your applications can run in the same data center, or be distributed across different regions across the world. Traffic Manager works by applying an intelligent routing policy engine to the Domain Name Service (DNS) queries on your domain names, and maps the DNS routes to the appropriate instances of your applications.
You can use Traffic Manager to improve application availability - by enabling automatic customer traffic fail-over scenarios in the event of issues with one of your application instances. You can also use Traffic Manager to improve application performance - by automatically routing your customers to the closet application instance nearest them (e.g. you can setup Traffic Manager to route customers in Europe to a European instance of your app, and customers in North America to a US instance of your app).
Getting Started
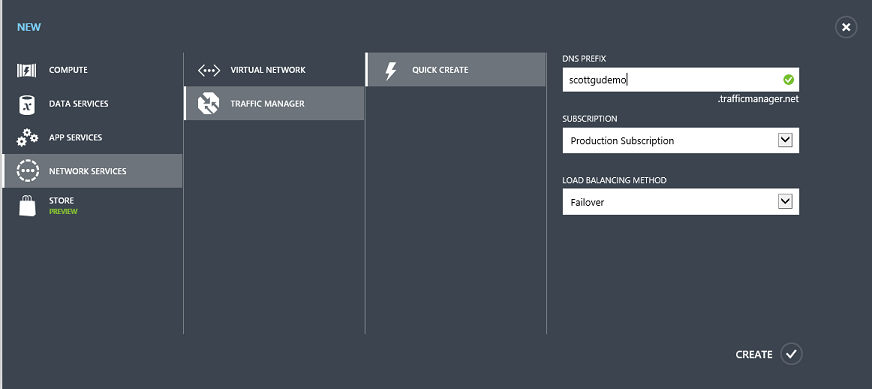
Setting up Traffic Manager is easy to do. Simply choose New->Network Services->Traffic Manager within the Windows Azure Management Portal:
When you create a Windows Azure Traffic Manager you can specify a “load balancing method” – this indicates the default traffic routing policy engine you want to use. Above I selected the “failover” policy.
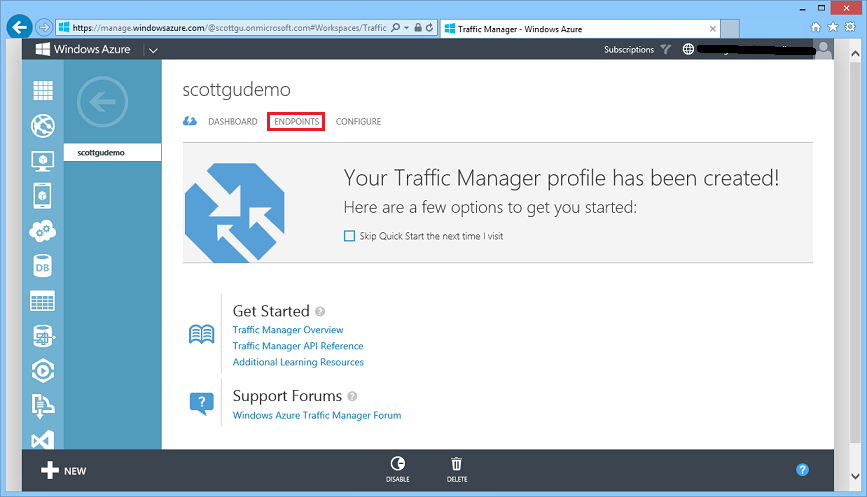
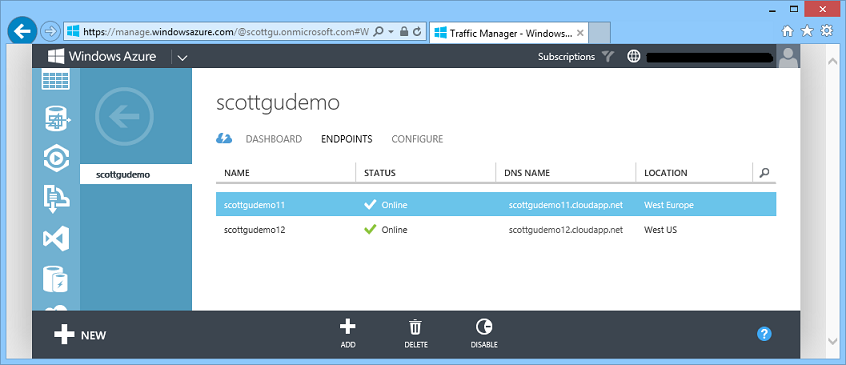
Once your Traffic Manager instance is created you can click the “endpoints” tab to select application or service endpoints you want the traffic manager to route traffic to. Below I’ve added two virtual machine deployments – one in Europe and one in the United States:
Enabling High Availability
Traffic Manager monitors the health of each application/service endpoint configured within it, and automatically re-directs traffic to other application/service endpoints should any service fail.
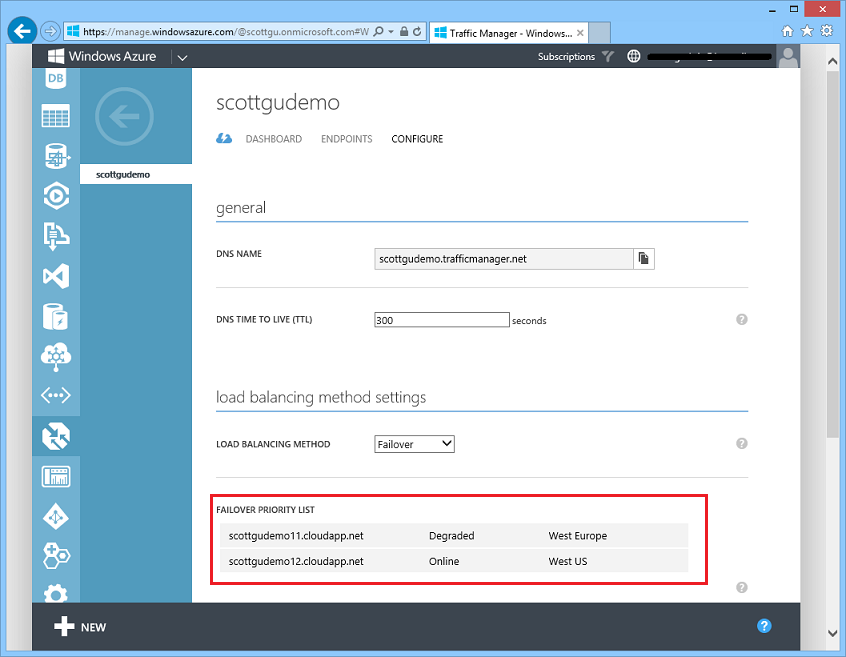
In the following example, Traffic Manager is configured in a ‘Failover’ policy, which means by default all traffic is sent to the first endpoint (scottgudemo11), but if that app instance is down or having problems (as it is below) then traffic is automatically redirected to the next endpoint (scottgudemo12):
Traffic Manager allows you to configure the protocol, port and monitoring path used to monitor endpoint health. You can use any of your web pages as the monitoring path, or you can use a dedicated monitoring page, which allows you to implement your own customer health check logic:
Enabling Improved Performance
You can deploy multiple instances of your application or service in different geographic regions, and use Traffic Manager’s ‘Performance’ load-balancing policy to automatically direct end users to the closest instance of your application. This improves performance for a end user by reducing the network latency they experience:
In the traffic manager instance we created earlier, we had a VM deployment in both West Europe and the West US regions of Windows Azure:
This means that when a customer in Europe accesses our application, they will automatically be routed to the West Europe application instance. When a customer in North America accesses our application, they will automatically be routed to the West US application instance.
Note that endpoint monitoring and failover is a feature of all Traffic Manager load-balancing policies, not just the ‘failover’ policy. This means that if one of the above instances has a problem and goes offline, the traffic manager will automatically direct all users to the healthy instance.
Seamless application updates
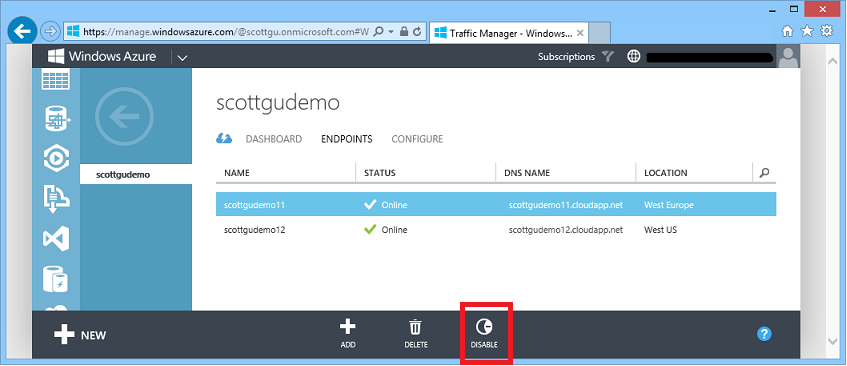
You can also explicitly enable and disable each of your application/service endpoints in Traffic Manager. To do this simply select the endpoint, and click the Disable command:
This doesn’t stop the underlying application - it just tells Traffic Manager to route traffic elsewhere. This enables you to migrate traffic away from a particular deployment of an application/service whilst it is being updated and tested and then bring the service back into rotation, all with just a couple of clicks.
General Availability
As Traffic Manager plays a key role in enabling high availability applications, it is of course vital that Traffic Manager itself is highly available. That’s why, as part of general availability, we’re announcing a 99.99% uptime SLA for Traffic Manager.
Traffic Manager has been available free of charge during preview. Free promotional pricing will remain in effect until December 31, 2013. Starting January 1, 2014, the following pricing will apply:
- $0.75 per million DNS queries (reducing to $0.375 after 1 billion queries)
- $0.50 per service endpoint/month.
Full pricing details are available on the Windows Azure Web Site. Additional details on Traffic Manager, including a detailed description of endpoint monitoring, all configuration options, and the Traffic Manager management REST APIs, are available on MSDN.
Active Directory: General Availability of Application Access
This summer we released the initial preview of our Application Access Enhancements for Windows Azure Active Directory, which enables you to securely implement single-sign-on (SSO) support against SaaS applications as well as LOB based applications. Since then we’ve added SSO support for more than 500 applications (including popular apps like Office 365, SalesForce.com, Box, Google Apps, Concur, Workday, DropBox, GitHub, etc).
Building upon the enhancements we delivered last month, with this week’s release we are excited to announce the general availability release of the application access functionality within Windows Azure Active Directory. These features are available for all Windows Azure Active Directory customers, at no additional charge, as of today’s release:
- SSO to every SaaS app we integrate with
- Application access assignment and removal
- User provisioning and de-provisioning support
- Three built-in security reports
- Management portal support
Every customer can now use the application access features in the Active Directory extension within the Windows Azure Management Portal.
Getting Started
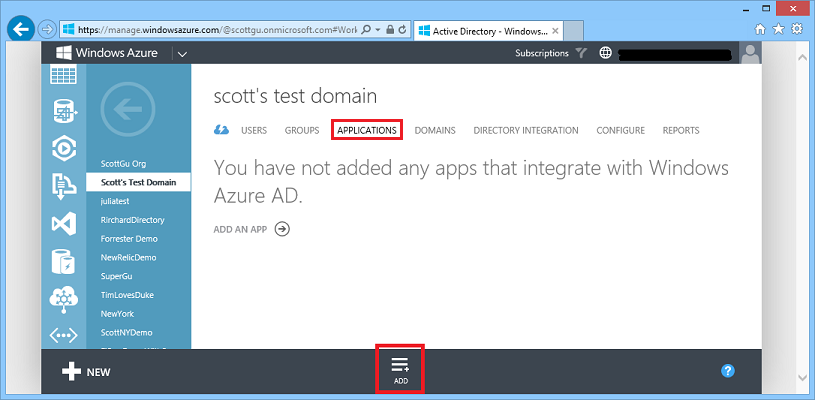
To integrate your active directory with either a SaaS or LOB application, navigate to the “Applications” tab of the Directory within the Windows Azure Management Portal and click the “Add” button:
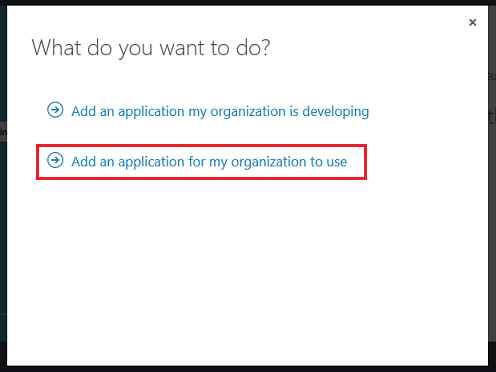
Clicking the “Add” button will bring up a dialog that allows you to select whether you want to add a LOB application or a SaaS application:
Clicking the second link will bring up a gallery of 500+ popular SaaS applications that you can easily integrate your directory with:
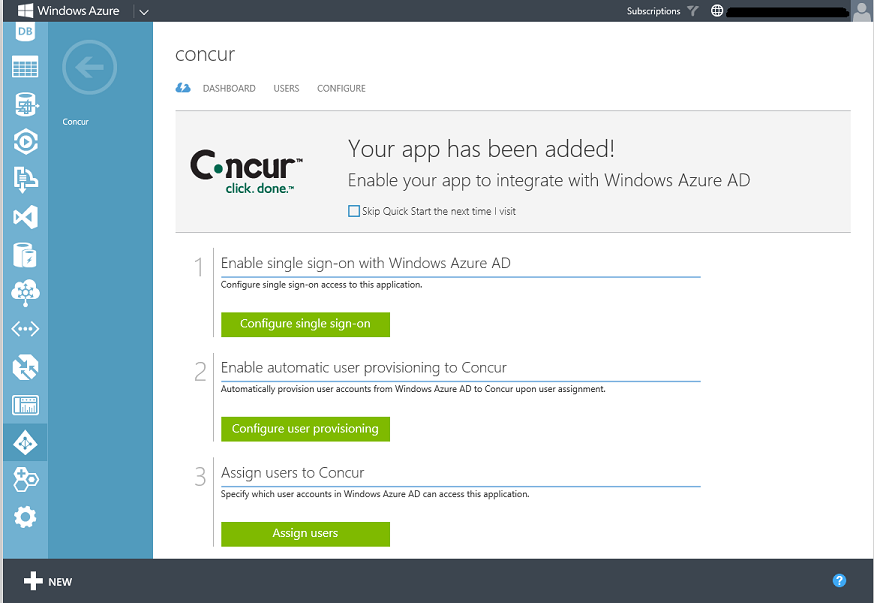
Choose an application you wish to enable SSO with and then click the OK button. This will register the application with your directory:
You can then quickly walkthrough setting up single-sign-on support, and enable your Active Directory to automatically provision accounts with the SaaS application. This will enable employees who are members of your Active Directory to easily sign-into the SaaS application using their corporate/active directory account.
In addition to making it more convenient for the employee to sign-into the app (one less username/password to remember), this SSO support also makes the company’s data even more secure. If the employee ever leaves the company, and their active directory account is suspended/deleted, they will lose all access to the SaaS application. The IT administrator of the Active Directory can also optionally choose to enable the Multi-Factor Authentication support that we shipped in September to require employees to use a second-form of authentication when logging into the SaaS application (e.g. a phone app or SMS challenge) to enable even more secure identity access. The Windows Azure Multi-Factor Authentication Service composes really nice with the SaaS support we are shipping today – you can literally set up secure support for any SaaS application (complete with multi-factor authentication support) to your entire enterprise within minutes.
You can learn more about what we’re providing with Azure Directory here, and you can ask questions and provide feedback on today’s release in the Windows Azure AD Forum.
Mobile Services: Active Directory integration, Xamarin support, Optimistic concurrency
Enterprises are increasingly going mobile to deliver their line of business apps. Today we are introducing a number of exciting updates to Mobile Services that make it even easier to build mobile LOB apps.
Preview of Windows Azure Active Directory integration with Mobile Services
I am excited to announce the preview of Widows Azure Active Directory support in Mobile Services. Using this support, mobile business applications can now use the same easy Mobile Services authentication experience to allow employees to sign into their mobile applications with their corporate Active Directory credentials.
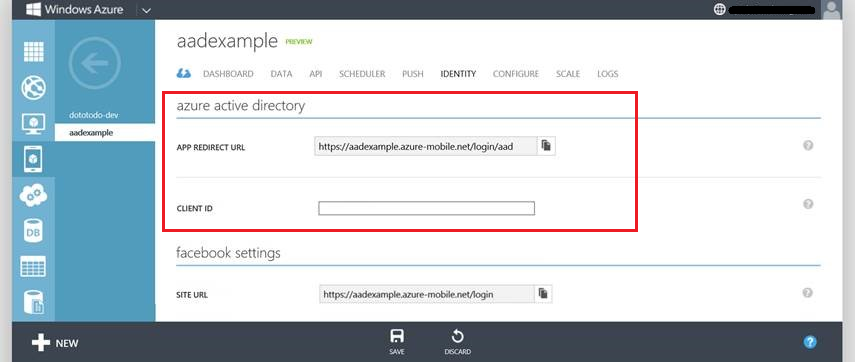
With this feature, Windows Azure Active Directory becomes supported as an identity provider in Mobile Services alongside with the other identity providers we already support (which include Microsoft Accounts, Facebook ID, Google ID, and Twitter ID). You can enable Active Directory support by clicking the “Identity” tab within a mobile service:
If you are an enterprise developer interested in using the Windows Azure Active Directory support in Mobile Services, please contact us at mailto:mobileservices@microsoft.com to sign-up for the private preview.
Cross-platform connected apps using Xamarin and Mobile Services
We earlier partnered with Xamarin to deliver a Mobile Services SDK that makes it easy to add capabilities such as storage, authentication and push notifications to iOS and Android applications written in C# using Xamarin. Since then, thousands of developers have downloaded the SDK and enjoyed the benefits of building cross platform mobile applications in C# with Windows Azure as their backend. More recently as part of the Visual Studio 2013 launch, Microsoft announced a broad collaboration with Xamarin which includes Portable Class Library support for Xamarin platforms.
With today’s release we are making two additional updates to Mobile Services:
- Delivering an updated Mobile Services Portable Class Library (PCL) SDK that includes support for both Xamarin.iOS and Xamarin.Android
- New quickstart projects for Xamarin.iOS and Xamarin.Android exposed directly in the Windows Azure Management Portal
These updates make it even easier to build cloud connected cross-platform mobile applications.
Getting started with Xamarin and Mobile Services
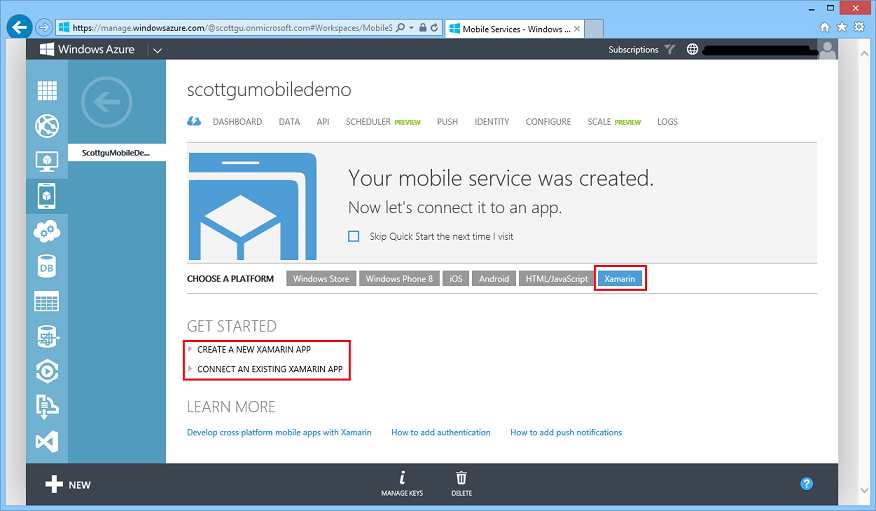
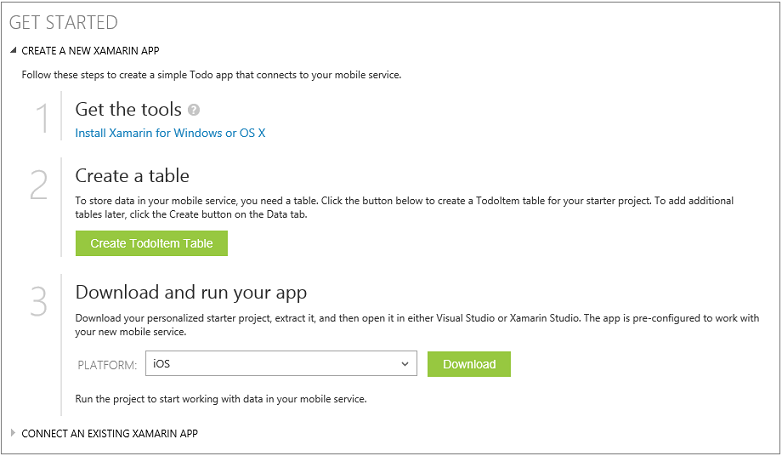
If you navigate to the quickstart page for your Windows Azure Mobile Service you will see there is now a new Xamarin tab:
To get started with Xamarin and Windows Azure Mobile Services, all you need to do is click one of the links circled above, install the Xamarin tools, and download the Xamarin starter project that we provide directly on the quick start page above:
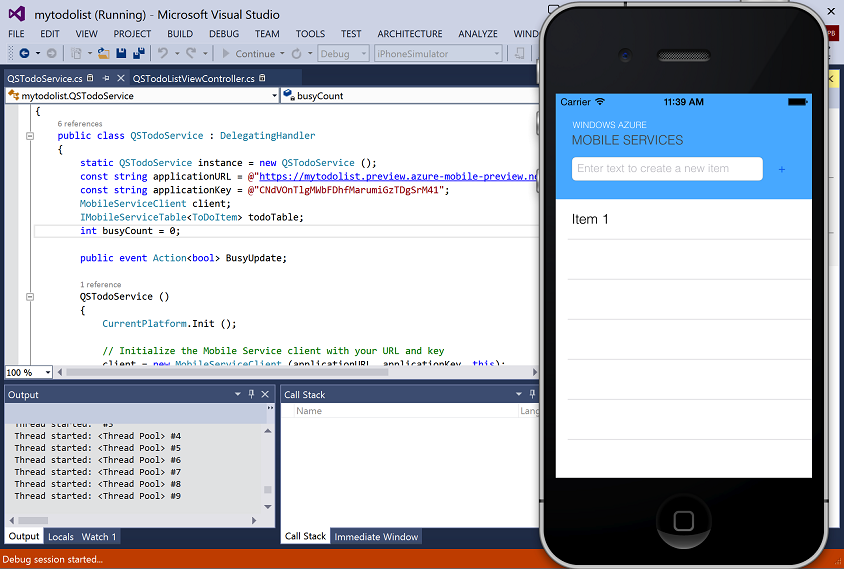
After downloading the project, unzip and open it in Visual Studio 2013. You will then be prompted to pair your instance of Visual Studio with a Mac so that you can build and run the application on iOS. See here for detailed instructions on the setup process.
Once the setup process is complete, you can select the iPhone Simulator as the target and then just hit F5 within Visual Studio to run and debug the iOS application:
The combination of Xamarin and Windows Azure Mobile Services make it incredibly easy to build iOS and Android applications using C# and Visual Studio. For more information check out our tutorials and documentation.
Optimistic Concurrency Support
Today’s Mobile Services release also adds support for optimistic concurrency. With optimistic concurrency, your application can now detect and resolve conflicting updates submitted by multiple users. For example, if a user retrieves a record from a Mobile Services table to edit, and meanwhile another user updated this record in the table, without optimistic concurrency support the first user may overwrite the second user’s data update. With optimistic concurrency, conflicting changes can be caught, and your application can either provide a choice to the user to manually resolve the conflicts, or implement a resolution behavior.
When you create a new table, you will notice 3 system property columns added to support optimistic concurrency: (1) __version, which keeps the record’s version, (2) __createdAt, which is the time this record was inserted at, and (3) __updatedAt, which is the time the record was last updated.
You can use optimistic concurrency in your application by making two changes to your code:
First, add a version property to your data model as shown in code snippet below. Mobile Services will use this property to detect conflicts while updating the corresponding record in the table:
publicclassTodoItem
{
publicstring Id { get; set; }
[JsonProperty(PropertyName = "text")]
publicstring Text { get; set; }
[JsonProperty(PropertyName = "__version")]
publicbyte[] Version { get; set; }
}
Second, modify your application to handle conflicts by catching the new exception MobileServicePreconditionFailedException. Mobile Services will send back this error, which includes the server version of the conflicting item. Your application can then decide on which version to commit back to the server to resolve this detected conflict.
To learn more about optimistic concurrency, review our new Mobile Services optimistic concurrency tutorial. Also check out the new support for Custom ID property support we are also adding with today’s release – which makes it much easier to handle a variety of richer data modeling scenarios (including sharding support).
Notification Hubs: Price Reduction and Debug Send Improvements
In August I announced the General Availability of Windows Azure Notification Hubs - a powerful Mobile Push Notifications service that makes it easy to send high volume push notifications with low latency to any mobile device (including Windows Phone, Windows 8, iOS and Android devices). Notification hubs can be used with any mobile app back-end (including ones built using Windows Azure Mobile Services) and can also be used with back-ends that run in the cloud as well as on-premises.
Pricing update: Removing Active Device limits from Notification Hubs paid tiers
To simplify the pricing model of Notification Hubs and pass on cost savings to our customers, we are removing the limits we previously had on the number of Active Devices allowed. For example, the consumption price for Notification Hubs Standard Tier will now simply become $75 for 1 million pushes per month, and $199 per 5 million pushes per month (prorated daily).
These changes and price reductions will be available to all paid tiers starting Dec 15th. More details on the pricing can be found here.
Troubleshooting Push Notifications with Debug Send
Troubleshooting push notifications can sometimes be tricky, as there are many components involved: your backend, Notification Hubs, platform notification service, and your client app.
To help with that, today’s release adds the ability to easily send test notifications directly from the Windows Azure Management portal. Simply navigate to the new DEBUG tab in every Notification Hub, specify whether you want to broadcast to all registered devices or provide a tag (or tag expression) to only target specific devices/group of devices, specify the notifications payload you wish to send, and then hit “Send”. For example: below I am choosing to send a test notification message to all my users who have the iOS version of my app, and who have registered to subscribe to “sport-scores” within my app:
After the notification is sent, you will get a list of all the device registrations that were targeted by your notifications and the outcomes of their specific notifications sent as reported by the corresponding platform notification services (WNS, MPNS, APNS, and GCM). This makes it much easier to debug issues.
For help on getting started with Notification Hubs, visit the Notification Hub documentation center.
Web Sites: Diagnostics Support for Automatic Logging to Blob Storage
In September we released an update to Windows Azure Web Sites that enables you to automatically persist HTTP logs to Windows Azure Blob Storage.
Today we also updated Web Sites to support persisting a Web Site’s application diagnostic logs to Blob Storage as well. This makes it really easy to persist your diagnostics logs as text blobs that you can store indefinitely (since storage accounts can maintain huge amounts of data) and which you can also use to later perform rich data mining/analysis on them. This also makes it much easier to quickly diagnose and understand issues you might be having within your code.
Adding Diagnostics Statements to your Code
Below is a simple example of how you can use the built-in .NET Trace API within System.Diagnostics to instrument code within a web application. In the scenario below I’ve added a simple trace statement that logs the time it takes to call a particular method (which might call off to a remote service or database that might take awhile):
Adding instrumentation code like this makes it much easier for you to quickly determine what might be the cause of a slowdown in an application in production. By logging the performance data it also makes it possible to analyze performance trends over time (e.g. analyze what the 99th percentile latency is, etc).
Storing Diagnostics Log Files as Blobs in Windows Azure Storage
To enable diagnostic logs to be automatically written directly to blob storage, simply navigate to a Web Site using the Windows Azure Management Portal and click the CONFIGURE tab. Then navigate to the APPLICATION DIAGNOSTICS section within it. Starting today, you can now configure “Application Logging” to be persisted to blob storage. To do this, just toggle the button to be “on”, and then choose the logging level you wish to persist (error, verbose, information, etc):
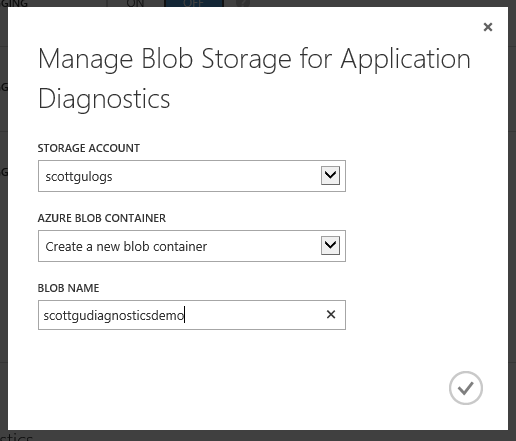
Clicking the green “manage blob storage” button brings up a dialog that allows you to configure which blob storage account you wish to store the diagnostics logs within:
Once you are done just click the “ok” button, and then hit “save”. Now when your application runs, the diagnostic data will automatically be persisted to your blob storage account.
Looking at the Application Diagnostics Data
Diagnostics logging data is persisted almost immediately as your application runs (we have a trace listener that automatically handles this within web-sites and allows you to write thousands of diagnostics messages per second).
You can use any standard tool that supports Windows Azure Blob Storage to view and download the logs. Below I’m using the CloudXplorer tool to view my blob storage account:
The application diagnostic logs are persisted as .csv text files. Windows Azure Web Sites automatically persists the files within sub-folders of the blob container that map to the year->month->day->hour of the web-site operation (which makes it easier for you to find the specific file you are looking for).
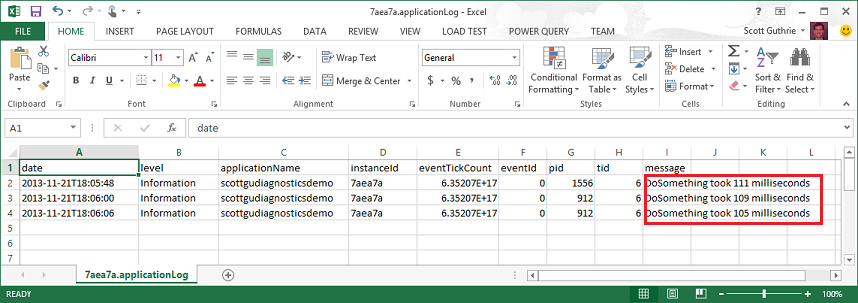
Because they are .csv text files you can open/process the log files using a wide variety of tools or custom scripts (you can even spin up a Hadoop cluster using Windows Azure HDInsight if you want to analyze lots of them quickly). Below is a simple example of opening the above file diagnostic file using Excel:
Notice above how the date/time, information level, application name, webserver instance ID, eventtick, as well as proceed and thread ID were all persisted in addition to my custom message which logged the latency of the DoSomething method.
Running with Diagnostics Always On
Today’s update now makes it super easy to log your diagnostics trace messages to blob storage (in addition to the HTTP logs that were already supported). The above steps are literally the only ones required to get started.
Because Windows Azure Storage Accounts can store 100TB each, and Windows Azure Web Sites provides an efficient way to persist the logs to it, it is now also possible to always leave diagnostics on in production and log everything you do within your application. Having this data persisted makes it much easier for you to understand the health of your applications, debug them when there are issues, and analyze them over time to make even better.
Storage: Support for Alerting based on Storage metrics
With today’s release we have added support to enable threshold based alert rules for storage metrics. If you have enabled storage analytics metrics, you can now configure alert rules on these metrics.
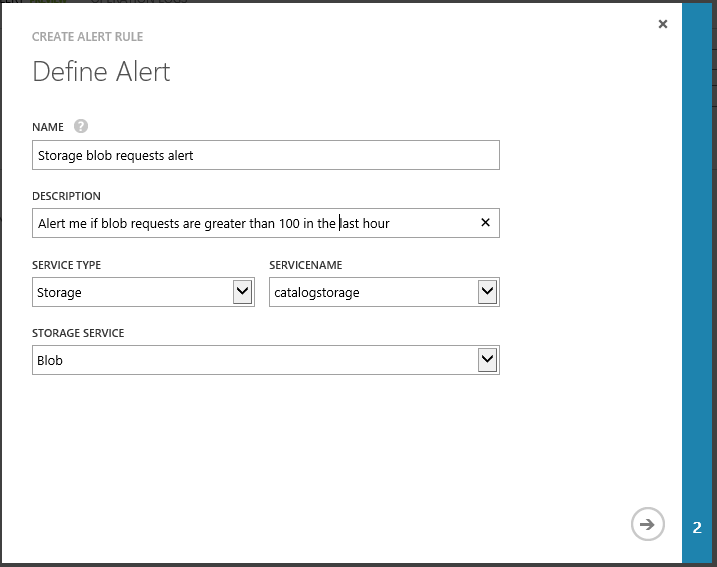
You can create an alert rule on storage metrics by navigating to Management Services -> Alert tab in the Windows Azure Management Portal. Click the Add Rule button, and then in the rule creation dialog select service type as storage, select the storage account that you want to enable alerts on, followed by the storage service (blob, table, queue).
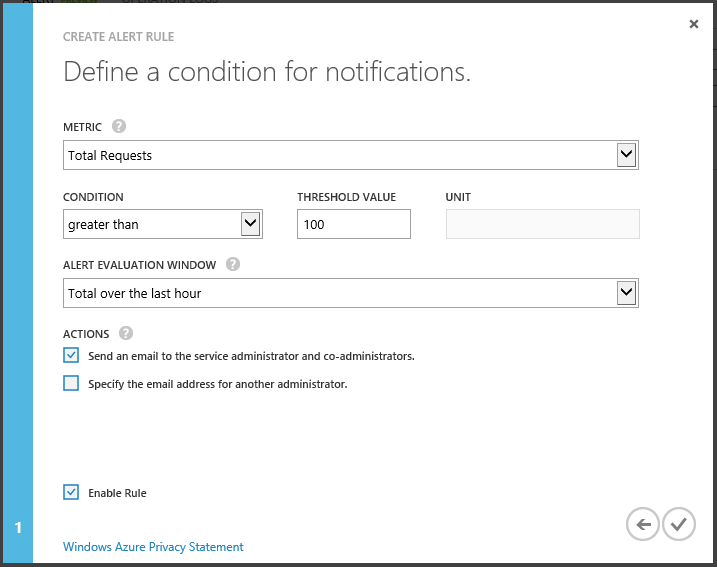
Then select the blob service metric and configure threshold value and email address to send the notification:
Once setup and enabled the alert will be listed in the alerts tab:
The rule will then be monitored against the storage metric. If it triggers above the configured threshold an alert email will automatically be sent.
Monitoring: Preview release of Windows Azure Monitoring Service Library
Today we are releasing a preview of our new Window Azure Monitoring Services library. This library will allow you get monitoring metrics, and programmatically configure alerts and autoscale rules for your services.
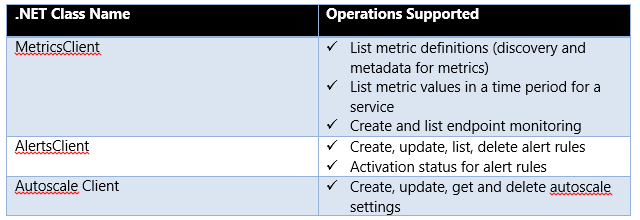
The list of monitoring services clients that we are shipping today include:
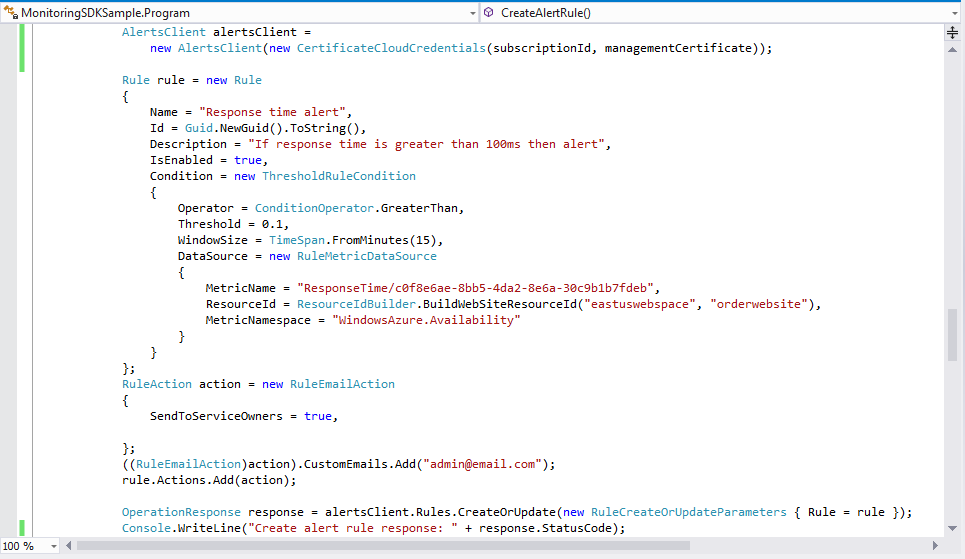
Let’s walk through an example of creating an alert rule using the AlertsClient library. For creating an alert rule you will need to specify the service that you are creating the alert on and the metric on which the alert rule operates. In addition, you will need to specify the rule settings for the condition and the action taken when the alert threshold is reached. The below code shows how to programmatically do this:
Once the code above executes our monitoring alert rule will be configured without us ever having to manually do anything within the management portal. You can write similar code now to retrieve operational metrics about a service and setup autoscale rules as well. This makes it really easy to fully automate tasks.
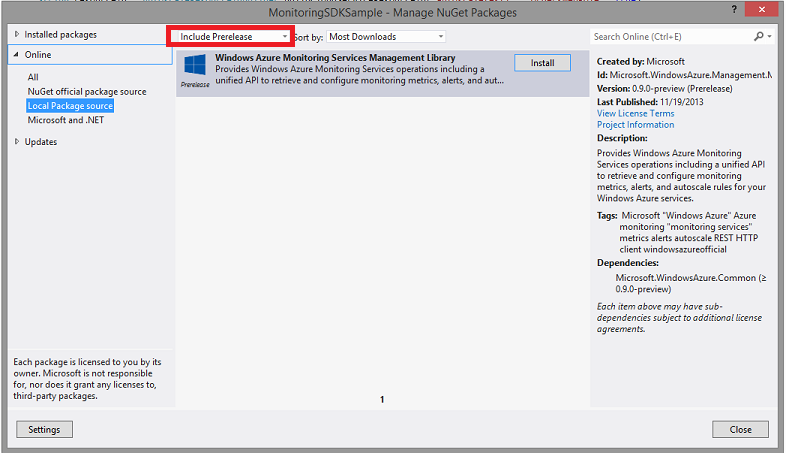
Installing via nuget
The monitoring service library is available via nuget. Since it is still in preview form, you’ll need to add the –IncludePrerelease switch when you go to retrieve the package.
Documentation
The alerts, autoscale and metrics client API documentation can be accessed here.
Summary
Today’s release includes a bunch of great features that enable you to build even better cloud solutions. If you don’t already have a Windows Azure account, you can sign-up for a free trial and start using all of the above features today. Then visit the Windows Azure Developer Center to learn more about how to build apps with it.
Hope this helps,
Scott
P.S. In addition to blogging, I am also now using Twitter for quick updates and to share links. Follow me at: twitter.com/scottgu
