 I've been working with Visual Studio 2015 lately, even for older projects. You can create and edit all kids of .NET app from .NET 2.0 all the way up through .NET 4.6, as well as ASP.NET 5 apps on the Core CLR.
In my case I've been doing some pair programming with Mark Downie on DasBlog, the blog system that runs this blog right here. DasBlog is very old, and used to be very actively developed. The question "is DasBlog dead" is asked a lot, but the answer is really "DasBlog is done." For years it has been very feature-full and feature-complete. However, this blog has been running on .NET 2.0 for years. Mark and I thought it would be nice to upgrade DasBlog to .NET 4.6, so we did. We've also moved DasBlog over to GitHub. You'll find it at http://github.com/shanselman/dasblog.
Now, to be clear, DasBlog was amazing in 2004 and 2008 but it's aging now. Mark and I think that's the fun of it, though. Mark's added Twitter Card and Facebook Open Graph support, and together we've fixed a few oddities and bugs that have popped up in the leap from 2.0 to 4.6. However DasBlog remains idiomatic .NET 2.0 which means it's C# 2.0, and doesn't even make good use of Linq or generics. We're thinking about a few updates, moving the Templating system to RazorEngine, updating to Linq queries, smarter threading for collections, better caching, as well of Mark's ideas around social.
You might think it's weird to use Visual Studio 2015 to work with a .NET 2.0 app, but it's useful to remember that you get to use new Visual Studio features even with older frameworks. One of the most useful new features is the Diagnostic Tools toolbox. It's a boring name for an amazing new part of VS. I'm not sure what they could call it other than Diagnostic Tools, but it's insanely convenient.

Often we think of Debugging and Profiling as two separate activities, and honestly, I talk to developers all the time that have never Profiled an app. They know that Profiling exists as a tool and a concept, but for whatever reason they forget about it, don't get around to it, or haven't adopted it as a fundamental part of their daily workflow.
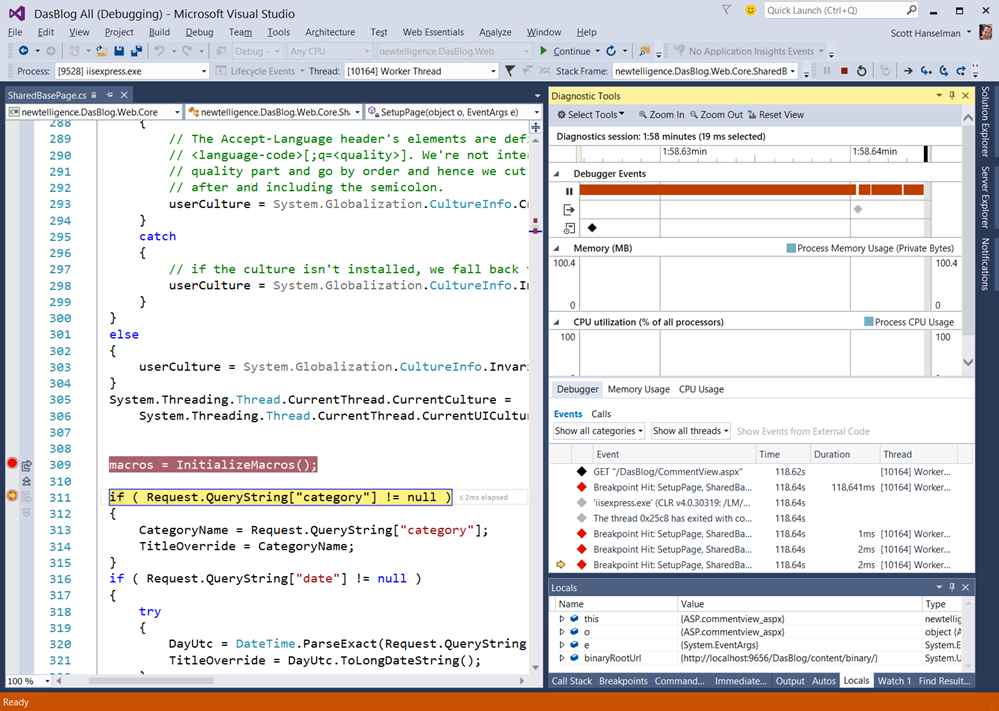
The Diagnostic Tools in Visual Studio 2015 bring in data from a number of sources, Breakpoints, the Debugger, Tracing and Debug out, as well as Intellitrace Events and Historical Debugging (on supported SKUs).
Notice in the screenshot above, I can even see a little tip showing how many milliseconds has elapsed between two breakpoints. It's little features like this that take data that has long been available but not in front of your face. Why dig for it?

I can even go back in time with Historical Debugging. See how I can backup and see the state of Local Variables and the Call Stack when I'm at a Breakpoint?

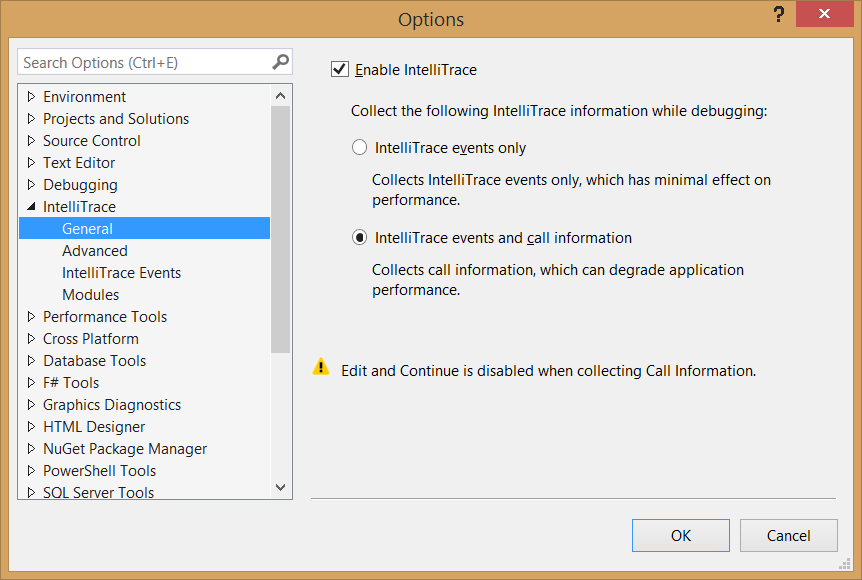
If you have a SKU with IntelliTrace, you can get extra info if you'd like to enable Historical Debugging.

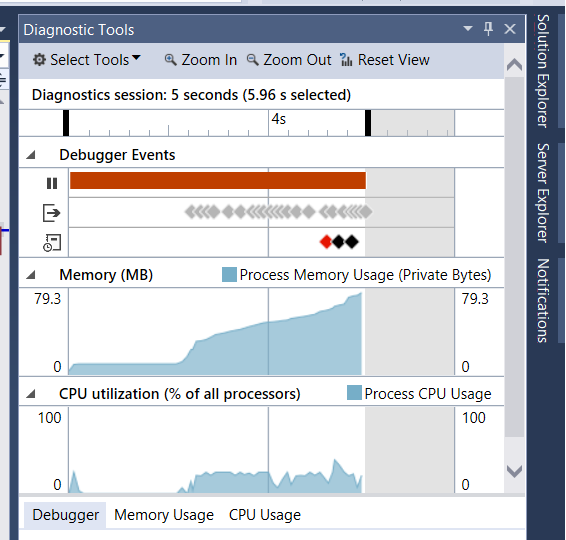
See how I've got Memory and CPU graphs, and I didn't have to do anything? This pops up automatically when Debugging:

I can take Memory Snapshots, go to the next Breakpoint, take another and compare!

If you've got Visual Studio 2015 and haven't started using these tools, I'd suggest you start exploring. They're useful enough that they've got me using VS2015 RC for all my projects, even older .NET 2.0 ones.
NOTE: Remember that Visual Studio Community is free for Open Source projects, and supports extensions! http://www.visualstudio.com/free
© 2015 Scott Hanselman. All rights reserved.


