Quantcast
Channel: Category Name
Viewing all 10804 articles
Browse latest View live

The week in .NET – Visual Studio 2017, .NET Core SDK, F# 4.1, On .NET with Phillip Carter, Happy Birthday from John Shewchuk, Pyre

$
0
0

Previous posts:

Visual Studio 2017, .NET Core SDK 1.0, F# 4.1

Yesterday, we had a big product launch! Visual Studio 2017 is here, and with it come the releases of .NET Core SDK 1.0, and F# 4.1. Check out the posts for all the details:

Get the bits now:

On .NET

In last week’s episode, Phillip Carter gave a tour of F#. This episode is two full hours of delicious F# aimed mainly at C# developers with no prior F# experience:

This week, we’ll have two shows. First, Scott Hunter will give a recap of yesterday’s announcements and what they mean for .NET. Second, we’ll have Matt Watson from Stackify to talk about Prefix, a lightweight dev tool for the Web that shows real-time logs, errors, queries, and more. We’ll stream live on Channel 9 at 9:30AM Pacific Time on Wednesday, then 10AM on Thursday. We’ll take questions on Gitter’s dotnet/home channel and on Twitter. Please use the #onnet tag. It’s OK to start sending us questions in advance if you can’t do it live during the shows.

Happy Birthday .NET!

We have another Happy Birthday .NET video for you this week. John Shewchuk is a Technical Fellow in charge of developer experience. He worked on Visual InterDev, drove the first release of Visual Studio, and was part of the architectural team for the very first and subsequent releases of .NET.

Tool of the week: FNA

FNA is a reimplementation of the Microsoft XNA libraries. The main contributor to the project, Ethan Lee, has ported two dozen XNA games already, including FEZ, Bastion, and Terraria.

Bastion running on FNA

Game of the week: Pyre

Pyre is a role-playing game in which you lead a band of exiles to freedom. To do this, you must fight through ancient competitions that are spread across a mystical purgatory. Each battle will bring you and your party closer to their freedom as they gain access to new abilities. Pyre will feature both a campaign and a two-player versus mode, letting you challenge a friend to one of fast-paced ritual showdowns.

pyre

Pyre is being created by Supergiant Games using C# and their own custom engine. It is under development but will be launching on Steam and PlayStation 4.

User group meeting of the week: Linux and microservice architecture in NC

Tonight Wednesday, March 8, at 5:30PM in Morrisville, NC, the TRINUG.NET group holds a meeting on .NET, Linux, and microservice architecture.

.NET

ASP.NET

C#

F#

New F# Language Suggestions:

Check out F# Weekly for more great content from the F# community.

Xamarin

UWP

Azure

Data

Games

And this is it for this week!

Contribute to the week in .NET

As always, this weekly post couldn’t exist without community contributions, and I’d like to thank all those who sent links and tips. The F# section is provided by Phillip Carter, the gaming section by Stacey Haffner, and the Xamarin section by Dan Rigby, and the UWP section by Michael Crump.

You can participate too. Did you write a great blog post, or just read one? Do you want everyone to know about an amazing new contribution or a useful library? Did you make or play a great game built on .NET?
We’d love to hear from you, and feature your contributions on future posts:

This week’s post (and future posts) also contains news I first read on The ASP.NET Community Standup, on Weekly Xamarin, on F# weekly, and on Chris Alcock’s The Morning Brew.


Celebrating the Women Who Inspire Us

$
0
0

Everyone can be part of helping to drive better outcomes for women around the world. For Bing, this means celebrating equality, and being a vehicle to share that voice.

Last year, Bing celebrated Women's History Month and International Women's Day with a quiz to test your knowledge on 'firsts for women.' On Bing in the Classroom, a series of exciting lesson plans helped students learn about the impact women are making in fields such as politics, STEM-related disciplines, and more. And perhaps you saw the Bing Homepage during this time:

Bing Homepage - Konak, Turkey

A wall in the shape of a woman’s face in Konak, Turkey was featured as the Bing homepage image in Australia, Brazil, Canada, France, Germany, Great Britain, Spain and the US.

International Women's Day

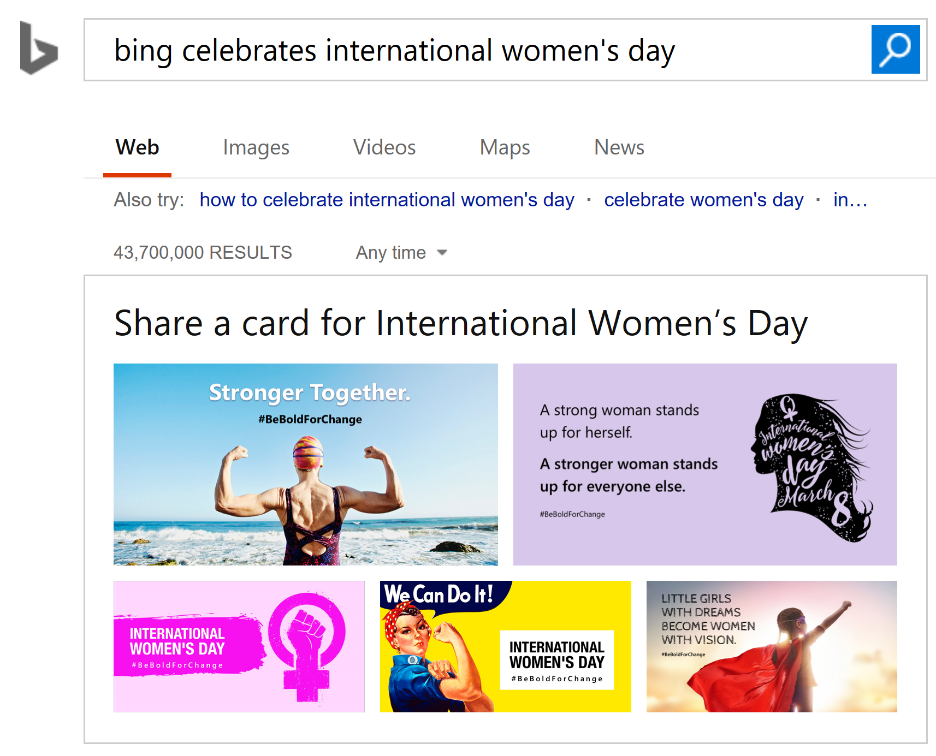
In celebration of International Women's Day, the Bing team invites you to share an inspirational greeting card with the inspirational women in your life. The official IWD campaign #BeBoldForChange calls on all of us to help forge a better working world—a more gender-inclusive world. We are excited to help you share that message through Bing. Share your story and inspire.

Bing Celebrates International Women's Day - Search results

International Women's Day - Share this card

Thank you raising awareness for a more inclusive world with Bing!

- The Bing Team

Optimize your productivity with .NET in Visual Studio 2017

$
0
0

Visual Studio 2017 makes you more productive by getting you to your code fast and helping you write code quickly. With improvements to performance, navigation, and debugging as well as the additions of new refactorings, code style configuration/enforcement, and live unit testing, this release is chock full of advancements. This post shows you how to take full advantage of these features.

Getting Started

Visual Studio 2017 significantly cuts down the time it takes to install, open Visual Studio, and write code in your solution. The new Visual Studio installer gives you the freedom to pick and choose exactly what you want installed.

After you install Visual Studio, you’ll notice how much faster the VS startup time and solution load time are:

  • The improvements made on Visual Studio startup time are illustrated in this blog post featuring a side-by-side video comparison.
  • You can enable lightweight solution load to lazily load projects. This is especially helpful if you work on a solution with hundreds of projects but you personally only work in one or two of those. You can enable lightweight solution load by going to Tools > Options > Projects and Solutions > Lightweight solution load for all solutions. Note: lightweight solution load does not work with F# projects.

Navigating Your Codebase

Visual Studio 2017 refreshes the navigation experience to help you get from A to B with greater confidence and fewer distractions:

  • Go To Implementation (Ctrl+F12) – navigate from any base type or member to its various implementations.
  • Go To All (Ctrl+T or Ctrl+,) – navigate directly to any file/type/member/symbol declaration. You can use the icons along the top of the feature to filter your result list or use the query syntax (e.g., “f searchTerm” for files, “t searchTerm” for types, etc.).
  • Find All References (Shift+F12) – now with syntax colorization, Find All Reference results can be custom grouped by a combination of project, definition, and path. You can also “lock” results so that you can continue to find other references without losing your original results.
  • Indent Guides ­– dotted, gray vertical lines act as landmarks in code to provide context within your frame of view. You may recognize these from the popular Productivity Power Tools.

gotoall

Writing Your Code

In this release, we have made a bunch of small tweaks and additions to help automate common tasks and speed up your workflow:

  • IntelliSense– filter your completion list by category by clicking on the icons in the tray or by hovering over them to learn the keyboard shortcut. This is great when you are learning a complex API or working in WPF and specifically looking for only properties or events, etc.
  • Refactorings – use ‘Ctrl+.’ to access all the refactorings and quick actions we’ve added in VS. Here is an overview:
    • Move type to file with same name
    • Sync file and type name
    • Add missing switch/Select case
    • Make method synchronous
    • Convert method to property, and vice versa
    • Convert to interpolated string
    • And many more!
  • Add using/Imports for types in reference assemblies/NuGet packages– if you type an unrecognized type, we will search for it in your reference assemblies and on NuGet.org and offer a quick fix to add the using/Imports. This feature is off by default; to enable it go to Tools > Options > Text Editor > [C#/Basic] > Advanced > Suggest usings for types in reference assemblies and Suggest usings for types in NuGet packages. Enabling the latter option will download 10 MB of a NuGet index on your machine and it will take several seconds to complete (this will not affect your workflow in VS, but it does means you cannot immediately use the feature once enabling it).
  • Code Suggestions – code suggestions let you hint best practices to developers. They surface in the editor as gray dots and you can apply suggestions with the command “Ctrl+.”.

intellisensefiltering

Driving Consistency and Readability

In Visual Studio 2017, you can configure and enforce your team’s coding conventions to drive consistency across your entire repository with EditorConfig. EditorConfig is an open file format and we worked with their community to support .NET code style within this format. Teams can configure convention preferences and choose how they are enforced inside the editor (as suggestions, warnings, or errors). The rules apply to whatever files are in the directory that contains the EditorConfig file. If you have different conventions for different projects, you can define each project’s rules in different EditorConfig files if the projects are in separate directories. Because, at the end of the day, EditorConfig is just a text file, it’s easy to check it into source control and have it live and travel with your source.

If you do not wish to use an EditorConfig file or you want to configure rules that your team hasn’t explicitly set, go to Tools>Options>Text Edtior> [C#/Basic]>Code Style to configure your machine local settings.

To get language service support when editing an EditorConfig file in VS, download Mads Kristensen’s extension. Learn more about coding convention support in VS2017 by reading our documentation or our post on the .NET blog.

Testing Your Code

Live Unit Testing reveals the impact of a code change on your unit tests almost instantly without you having to shuffle between the editor and the Test Explorer to manually run your tests. The icons on each line of code illustrate whether the line is hit by all passing tests (green check), at least one failing test (red ex), or if it is not covered by any tests (blue dash). To enable Live Unit Testing for your solution, go to Test > Live Unit Testing > Start.

For those of you with large solutions, we enable you to select which tests you want to be “live”. From the Solution Explorer, you can right-click on a project to Include/Exclude it from the Live Test Set or if you are within a test file, you can highlight a group of tests and right-click to Include/Exclude them. You can play with other settings for Live Unit Testing by going to Tools > Options > Live Unit Testing.

To learn more about Live Unit Testing and how it can save you time and effort, read this blog post.

lut

Debugging

Visual Studio 2017 builds upon the debugging experience to help you identify the source of an issue faster:

  • The new Exception Helper puts the most important information from an exception at the top-level, like inner exception details and the expression that returns null. From the Exception Helper you can also choose to disregard certain exception types while debugging—such as exceptions thrown by third-party libraries.
  • Run To Click executes a developer’s program until it reaches the target line of code and breaks in debug mode. This feature saves you time by acting as a temporary breakpoint.
  • XAML Edit and Continue lets you change your XAML while your app is running so that you can continuously tweak your UI. Note: this feature was originally added in Visual Studio 2015 Update 2.
  • Reattach To Process enables you to quickly reattach to previous debug targets. After you have manually attached once, you don’t have to waste time in the Attach to Process dialog to debug that same application. You can find this feature under Debug > Reattach to process… or with the command “Shift+Alt+P”.

exceptionhelper

Moving Your Code Forward with C# 7.0 and VB 15

The release of Visual Studio 2017 coincides with the final versions of C# 7.0 and VB 15. The new language features in these releases help you work with data and write more condensed code.

When adopting these new features into your everyday development, note:

  • To use tuples in C# and Visual Basic you must have the ValueTuple package installed. If you enable the Add using/Imports for NuGet package setting mentioned in the Writing Your Code section, you can add this package with one-click via “Ctrl+.”.
  • We added a ton of quick actions to help you embrace new language features, such as:
    • Use throw expression (C# 7.0) and null-coalescing operator (??) to simplify null-check.
    • Use explicitly provided tuple name (C# 7.0).
    • Use pattern-matching (C# 7.0) to simplify null-check.
    • Convert string.Format or concatenated string to an interpolated string (C# 6.0).
    • Use expression-bodied member for methods/constructors/indexers/properties/operators/accessors (C# 6.0/7.0).

Don’t forget to follow the language design for C# and Visual Basic on our new GitHub repos, CSharpLang and VBLang.

vbtupleexplicittype

Learning Hotkeys

Become a power user of Visual Studio by familiarizing yourself with common shortcut keys outlined in this cheat sheet. If you are coming to Visual Studio from another IDE, try Justin Clareburt’s Hot Keys 2017 extension to remap the default Visual Studio shortcuts to the ones you are used to.

Downloading Visual Studio 2017

With all the improvements to performance, navigation, debugging, refactorings, code style configuration/enforcement, and live unit testing there is no time to waste! Download Visual Studio 2017 today and take advantage of all the productivity features we have added to save you time and effort.

If you think we are missing a refactoring or quick action, please let us know by filing an issue on our GitHub.

imageKasey Uhlenhuth, Program Manager, .NET & Visual Studio
@kuhlenhuth
github.com/kuhlenh  Kasey is a program manager on the .NET Managed Languages team at Microsoft and is currently working on modernizing the C# and VB developer experience. Previously, she worked on C# Interactive and Node.js Tools for Visual Studio.

Iterations on infinity

$
0
0

iconarraymast1

Developers like you live with the Visual Studio icons every day: clicking on them multiple times, staring at them side by side on the taskbar, and seeing them attached to project files. So when we update them, it’s a big deal. After all, icons matter. For pictures that are at most just under a centimeter wide on a normal display (or under half an inch, for those of you who aren’t British like me), icons are huge. They pack a lot of meaning into a small space. They offer clues as to what kind of experience you’ll have with the application the icon represents. Some icons even establish an emotional connection: they make you feel something about something.

We’ve started rolling out a new series of icons to represent the Visual Studio product family. The classic purple infinity shape that you already know and recognize is sticking around. But you might say it’s gotten a promotion of sorts: the purple infinity by itself now represents the entire suite of products you’ve come to rely on. That includes our flagship Visual Studio IDE, Visual Studio Team Services, Blend for Visual Studio, and Visual Studio Mobile Center. The family also includes a macOS-style icon for Visual Studio for Mac, and a new icon for Visual Studio Code that will be revealed soon.

But the infinity symbol by itself isn’t enough. One of the problems our users have brought up for some time is not being able to tell different versions of Visual Studio products apart. For example, we had light blue icons for both Visual Studio Code and Visual Studio Team Services. That’s our fault, not yours. Even our own designers couldn’t always tell you which blue was which, and why. That got confusing for us, which meant it had to be confusing for you.

So we literally went back to the drawing board, if you’ll forgive the pun. We had a friendly competition among multiple design teams across three continents working on and iterating different concepts for the icon set. Icons for a major product family like Visual Studio should be visually attractive, but the requirements don’t stop there. They have to effectively communicate to a worldwide audience.

We faced several challenges designing this new icon set. Because the infinity shape has such strong existing-vsbrand recognition in the developer space, we wanted the new icons to look and feel as if they were an extension of that brand. To achieve this, the new icon set needed to be in the same style as the existing infinity shape. Deconstructing the infinity shape, it fits onto an underlying grid with two-point perspective. It’s got a thin vertical line on the left and a thick vertical line on the right, and the shape as a whole is made entirely of straight lines and strong angles that could be created by folding a ribbon. Finally, one of the most crucial directives our designers had was to follow was to use only a single flat color for each icon. Each new icon had to follow all these rules, using only one color, straight lines, ribbon folds for all corners, and trying to retain a thin vertical line on the left and a thick vertical line on the right. Different but similar. It wasn’t an easy task, even for some of the best artists and designers in the industry.

Within these start-menuconstraints and with the objective of building a whole icon set that conveys a sense of family, I’m quite proud of what our designers have accomplished. Most importantly, this new icon set has the familiar feeling of a Microsoft product family that’s part of the existing Microsoft brand. This familiar feeling is hard to pin down, but it’s essential. As I mentioned earlier, the purple infinity symbol is still around. In its classic dark purple, it now represents the whole Visual Studio family of products. In a lighter hue and with a stylized border, it represents our main IDE. You’ll absolutely know what to expect when you click on it. That’s a good thing.

The stylized border in the refreshed Visual Studio IDE icon is used in our other updated product icons as well. But instead of having to remember which icon is Visual Studio Code and which icon is Visual Studio Team Services based solely on color, each product icon now includes a unique pictogram that captures the individual flavor of each product. As each icon gets finalized and hard-coded into our different products, you’ll be able to tell that Blend and Code are both Visual Studio products, but are not the same thing. You’ll be able to tell the difference between Visual Studio Mobile Center and Visual Studio Team Services, and at the same time see that they’re part of the same product family.

vs-for-mac-logoIf you’re using Visual Studio for Mac, you’ll notice that the new product icon combines elements of both macOS and Windows visual design. We’ve used the purple infinity symbol, and set it against the common macOS pattern of a rotated rectangle. To make it pop on the macOS Dock, the Visual Studio for Mac icon has some added shading and detail.

Ultimately, the reason we put so much time and energy into refreshing these icons was to make your job easier. We always want you to be confident when you click on one of our icons, so you can get down to coding and focus on what you really want to focus on: making the best software in the world. Did we get it right? Tell us at UserVoice or use the Send Feedback tool in Visual Studio.

john-leaJohn Lea, Principal Design Director, Developer Division


Customized backlog levels, mobile work item form improvements, notifications for extensions – Mar 8

$
0
0

Note: The features discussed in this post will be rolling out over the next three weeks.

We have been focusing on improving your Team Services experience. This sprint includes several items, such as mobile work item form improvements and custom backlog levels. Let’s get into these features!

Delivery Plans field criteria

Delivery Plans have become more customizable with the addition of field criteria. This will give you greater control of which work items appear on your plans. Because field criteria is part of the plan, everyone will always see this same view of work. You can see in the example below that we are using field criteria to show only a certain work item type (bug) that contains a tag value (Argo).

delivery plans

New mobile discussion experience

Our mobile discussion experience has been optimized to provide a mobile-friendly, streamlined experience for submitting a comment. Discussion is the most common action that takes place in a mobile device. We look forward to hearing what you think about our new experience!

mobile discussion menu

mobile discussion

Optimized mobile identity picker

It is now extremely easy to assign a work item to a different user from your phone. The control has been optimized to provide a great mobile experience when filtering, searching, and selecting a user.

mobile identity

Customized backlog levels

Users can now add new backlog levels to manage the hierarchy of their work items and name them in a way that makes sense for their work item types. Users can also rename and recolor existing backlog levels, such as Stories or Features.

backlog levels

Custom work item identity fields

Users can now add custom identity fields to their projects. This allows users to define additional fields like “Assigned To”, which will give users a people-picker experience to select people as the field value. In this initial release, all users in the Team Services account will be valid values for each identity field.

Pull Request improvements for teams

If you’re a member of multiple teams, you will now see all of the PRs assigned to those teams listed in the My Pull Requests view. This makes the My Pull Requests view the one stop you need to visit to see all the PRs on your plate.

pr

In a future release, we’ll add teams to the Pull Requests hub under Code to make it easier to see all of your PRs for a single project.

New policy for no active comments

Ensure that all comments in your pull requests are being addressed with the new Comments policy. With this policy enabled, active comments will block completion of the PR, forcing all comments to be resolved. Reviewers that leave comments for the PR author but optimistically approve the pull request can be sure that an author that’s eager to merge won’t miss any comments.

pr policy

Build agent upgrade status

When an agent is being upgraded, it now indicates the status of the upgrade in the queue and pool management portal.

Github pull request builds

For a while, we’ve provided CI builds from your GitHub repo. Now we’re adding a new trigger so you can build your GitHub pull requests automatically. After the build is done, we report back with a comment in your GitHub pull request.

For security, we only build pull requests when both the source and target are within the same repo. We don’t build pull requests from a forked repo.

github builds

Out-of-the-box notifications enabled by default - coming soon

For your awareness, we are planning to enable out-of-the-box notifications by default in our next update in about three weeks. If this feature is already enabled in your account, there will be no impact. If you haven’t enabled this feature, it will be enabled by default in our next update. Account admins will still have the option to opt out of this feature.

Getting notified when extensions are installed, require attention, and more

Admins, or those with the ability to manage extensions for an account, are now automatically notified when an extension is installed, uninstalled, enabled, disabled, or requires attention in the account. This is especially useful in larger accounts where multiple people have the responsibility of managing extensions. Admins can turn off these notifications by navigating to Notification settings under the profile menu and switching off the extensions toggle.

Admins can also define custom subscriptions for extension-related events in the account. For example, an admin can get notified whenever any extension is updated in the account.

Users can also now turn off automatic notifications about their extension requests.

Release level approvals

You can now choose to automatically approve deployments that were automatically triggered after successful deployment to another environment. Approving a chain of deployments (which have the same approvers) can be done at one go if you choose to not approve every deployment.

Let’s say you have two environments Dev and Test, with the predeployment approvers set to “userA” and “userB,” with both of them required to approve the deployment. If the policy on Test is set as shown below, during deployment time it will be sufficient for userA and userB to approve only Dev. Deployment to Test will get auto-approved. If the deployment to Test is triggered manually, the approvals will be required before deployment to ensure correct approvals.

release approvers

.NET Core tasks support project files

With the current update, we are enhancing .NET core tasks to support *.csproj files in addition to project.json. You can now use Visual Studio 2017 on your build agents to build .NET core applications using csproj files.

We think these features will help improve your workflows while addressing feedback, but we would love to hear what you think. Please don’t hesitate to send a smile or frown through the web portal, or send other comments through the Team Services Developer Community. As always, if you have ideas on things you’d like to see us prioritize, head over to UserVoice to add your idea or vote for an existing one.

Thanks,

Aaron Bjork

Team Foundation Server 2017 Update 1 Available

$
0
0

Sorry, I had a farm day yesterday and am a little late on the announcement…

Yesterday we announced the release of both Visual Studio 2017 and TFS 2017 Update 1.  I’ll focus on TFS and you can read Julia’s post on VS.

IMPORTANT NOTE – A couple of days ago, we discovered a bug that was introduced very late that causes issues when upgrading a pre-TFS 2015 server.  There are no issues upgrading any TFS 2015 (or any Update to 2015).  Do not try to upgrade an earlier server yet.  We will update the installer bits on Friday with a fix and, as long as you download it after that, it should work on any supported TFS version.  I will update this post once the fix has been uploaded.  You don’t need to worry about TFS 2015 upgrades.  The issue is in the upgrade logic and has no effect whatsoever on TFS 2015 upgrades.  I apologize for making customers on earlier versions wait a little longer.

Other TFS related 2017 downloads:

Please checkout the release notes to see all the great stuff that’s in Update 1.  We’re thrilled to have been able to make it available to you.  We’re already hard at work on Update 2 (which I expect sometime this summer).  To get a sneak peek at what’s coming, check out our Feature Timeline.

As always, we are eager to hear your feedback,

Brian


Team Services Update – Mar 8, 2017

$
0
0

This week we are deploying our sprint 114 work.  Check out the release notes to read the details.  As usual, it will take a couple of weeks for the changes to roll out across all accounts.

Here’s a CliffsNotes version of some of the highlights of this sprint:

  • Delivery plans continue to make progress with new abilities to filter the cards on your board.
  • The mobile work item experience gets a new mobile optimized discussion control.
  • Pull Requests now understand teams and will show you all pull requests assigned to any team you are a member of.
  • Teams that do development on GitHub can now use the Team Services CI/CD experience for GitHub pull request builds (CI builds already worked).

I hope you enjoy the new improvements and I look forward to hearing your feedback…

Brian

Run To Click Debugging in Visual Studio 2017

$
0
0

You have many options when navigating through your code with the debugger in Visual Studio including setting breakpoints, stepping, and using Run to Cursor. In Visual Studio 2017 we have introduced Run to Click, a new way to more easily debug your code – point and click style. You no longer need to set temporary breakpoints or step several times to execute your code and stop on the line you want. You now can get all the benefits of Run to Cursor (Ctrl+Shift+F10) without searching through the context menu or taking your hand off the mouse for a two handed shortcut combination. Run to Click works while debugging in any programming language in VS including C#, VB, C++, and Python.

Point and Click Debugging

When stopped at a break state under the debugger, a light green “run execution to here” glyph subtly appears next to a line of code where your mouse is hovered.

RunToClickICONOff

Move your mouse to the glyph and click the button. Your code will run and stop on that line the next time it is hit in your code path.

RunToClickICONOn

This is especially useful if you naturally have one hand on the mouse while debugging to inspect variables with data tips in your code. You can quickly Run to Click a line of code, inspect the variables on that line, and then continue debugging all while keeping focus and attention in that location. Run to Click between the same method, different methods, and within loops!

RunToClickBasic

Special Notes

Remember that Run to Click will run the execution of your application that you are debugging until that line of code is reached.

  • If you click on a line of code that won’t be hit, the application with finish executing.
  • If you click on a line of code that resumes the application waiting for additional user input, once that code path is triggered by the input, you will break where you performed the Run to Click.
  • If you Run to Click on a line and the execution path triggers a breakpoint, the debugger will stop at any breakpoints in the path. When you hit “continue” (F5) execution will continue and you will stop on the line where you triggered run to click (just like if you had set a breakpoint on that line).

You can turn off Run to Click from the checkbox Debug/Options/Enable Run to Click.

Wrap Up

Run to Click improves your productivity by helping you get to the code you want to inspect faster. Try it out by downloading Visual Studio now (https://www.visualstudio.com/downloads/) and let me know what your think! We are always wanting your feedback so drop your questions and comments in the section below, or tweet @VS_Debugger.


Relationship Hacks - Mindfulness - Don't live your life by default

$
0
0

Setting the DefaultsI'm setting a goal for myself to finish my half-finished book relationshiphacks.com this year. In an attempt to make that happen (and because the recent podcast with my wife was wildly popular) I'm going to try to blog some guiding principles. Then I'll attempt to collect the feedback and comments, improve the posts, then move them into the book. Yesterday I posted about "An allowance system for adults."

In this post on I want to touch briefly on the concept of "mindfulness." When I was younger I didn't know this term so I said "don't live your life by default." Phrased alternatively, "don't let your life happen by default."

I mentioned it years ago on a podcast and Paul Apostolos did a very nice blog post where he paraphrased:

Teach your children to make life choices rather than just let life happen to them.

Now, to be clear, stuff happens and this isn't always possible. There's luck, there's planning, there's inherent privilege, but the root idea of mindfulness and awareness is crucial. As they say, "Luck Is what happens when preparation meets opportunity"

I met with a young mentee today who is considering not just leaving her job but also moving to a totally different career. What I appreciated about her perspective and questions was that she clearly was going into the future fully aware of the possibilities. She embraced both the potential good and bad possibilities with a conscious and mindful awareness that was inspiring.

She wasn't going to just "let whatever happen, happen." She wasn't going to just start the game and accept the defaults. She is opening open the options menu of life and trying to change the settings consciously.

I'm doing my best to teach my kids this, hopefully by example. Yes there are things they can't change about themselves, but the one thing they can change (or try) is how they think and how they act. I catch them saying things like "I'm not good at math." They have tapes that are already starting to run in their little heads that feed them negativity and inaction. The defaults are just doing nothing. Humans (myself included) can be very lazy. I want them to build up their reservoirs of self-esteem and "I can do it" so they don't accept the defaults.

Do you have any stories of where you "woke up" and realized you were coasting (perhaps for a week, perhaps for years) and were just accepting the defaults in your life? How did you break out of that thinking?


Sponsor: Get next level application monitoring with Raygun - The revolutionary software intelligence platform for your web and mobile apps. Take a free trial today!


© 2017 Scott Hanselman. All rights reserved.
     

160+ Code Samples for Bing Maps V8 released on GitHub

$
0
0

The Bing Maps team has been working hard on adding features and functionalities to the Bing Maps Version 8 web control (V8). With each feature the team creates they also create several code samples to thoroughly test it. Many of the basic implementation samples are made available as code samples in the Bing Maps V8 interactive SDK while more in-depth code samples have generally been made available through blog posts, MSDN documentation and as answers to developers on the Bing Maps forums. Today we are happy to announce the release of the Bing Maps V8 Code Samples project on GitHub, which pulls all these code samples into a single place. Check out the GitHub Project or view the Live Code Samples site. Here are a few of the samples included in this project.

Spider Clusters

The following is the Spider Clusters sample, which demonstrates how to take clustered pushpins and display the pushpins they contain in a connected spiral when they are clicked.

Try it now | Source Code

North Carolina Map

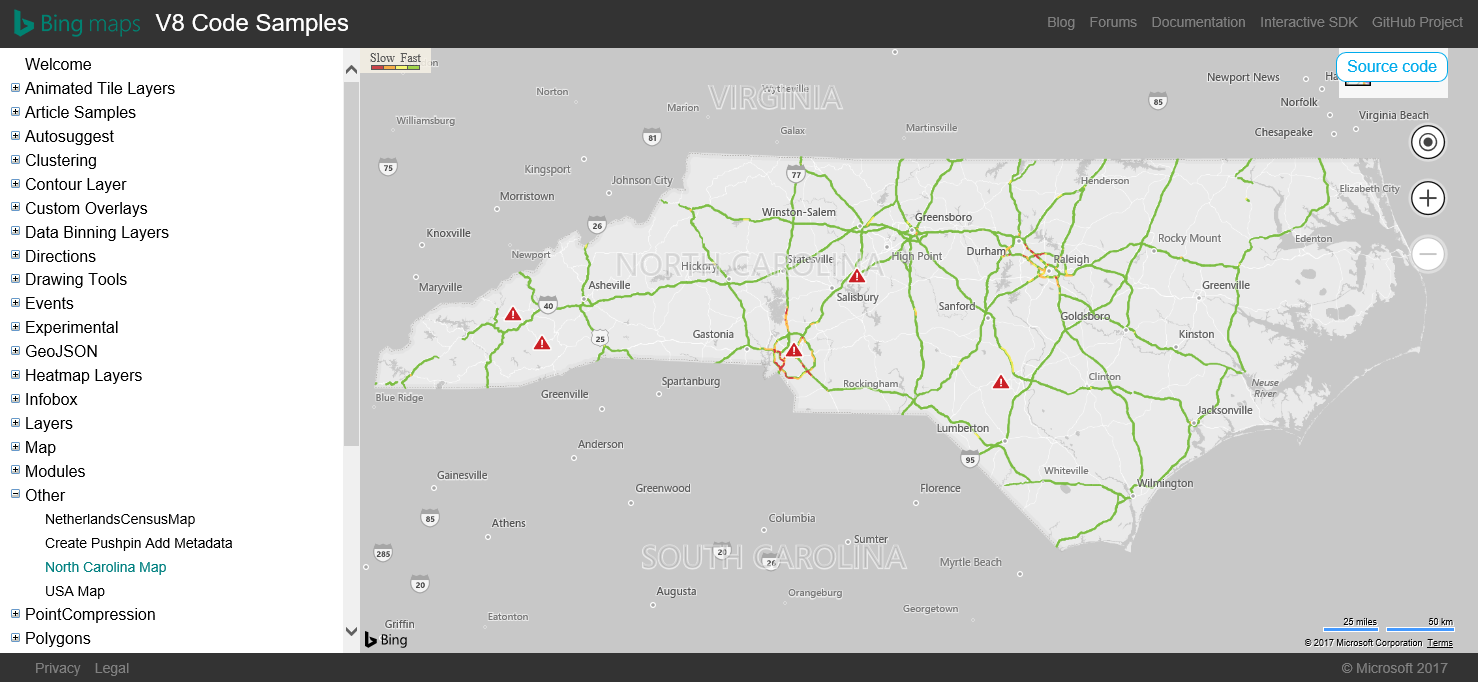
This sample shows how to create a map that focuses on a specific area. Besides locking the map view to that area, a polygon mask is also added to the map to hide rods and traffic data that is outside of the area of interest, in this case North Carolina.

Try it now | Source Code

Cardinal Spline Features

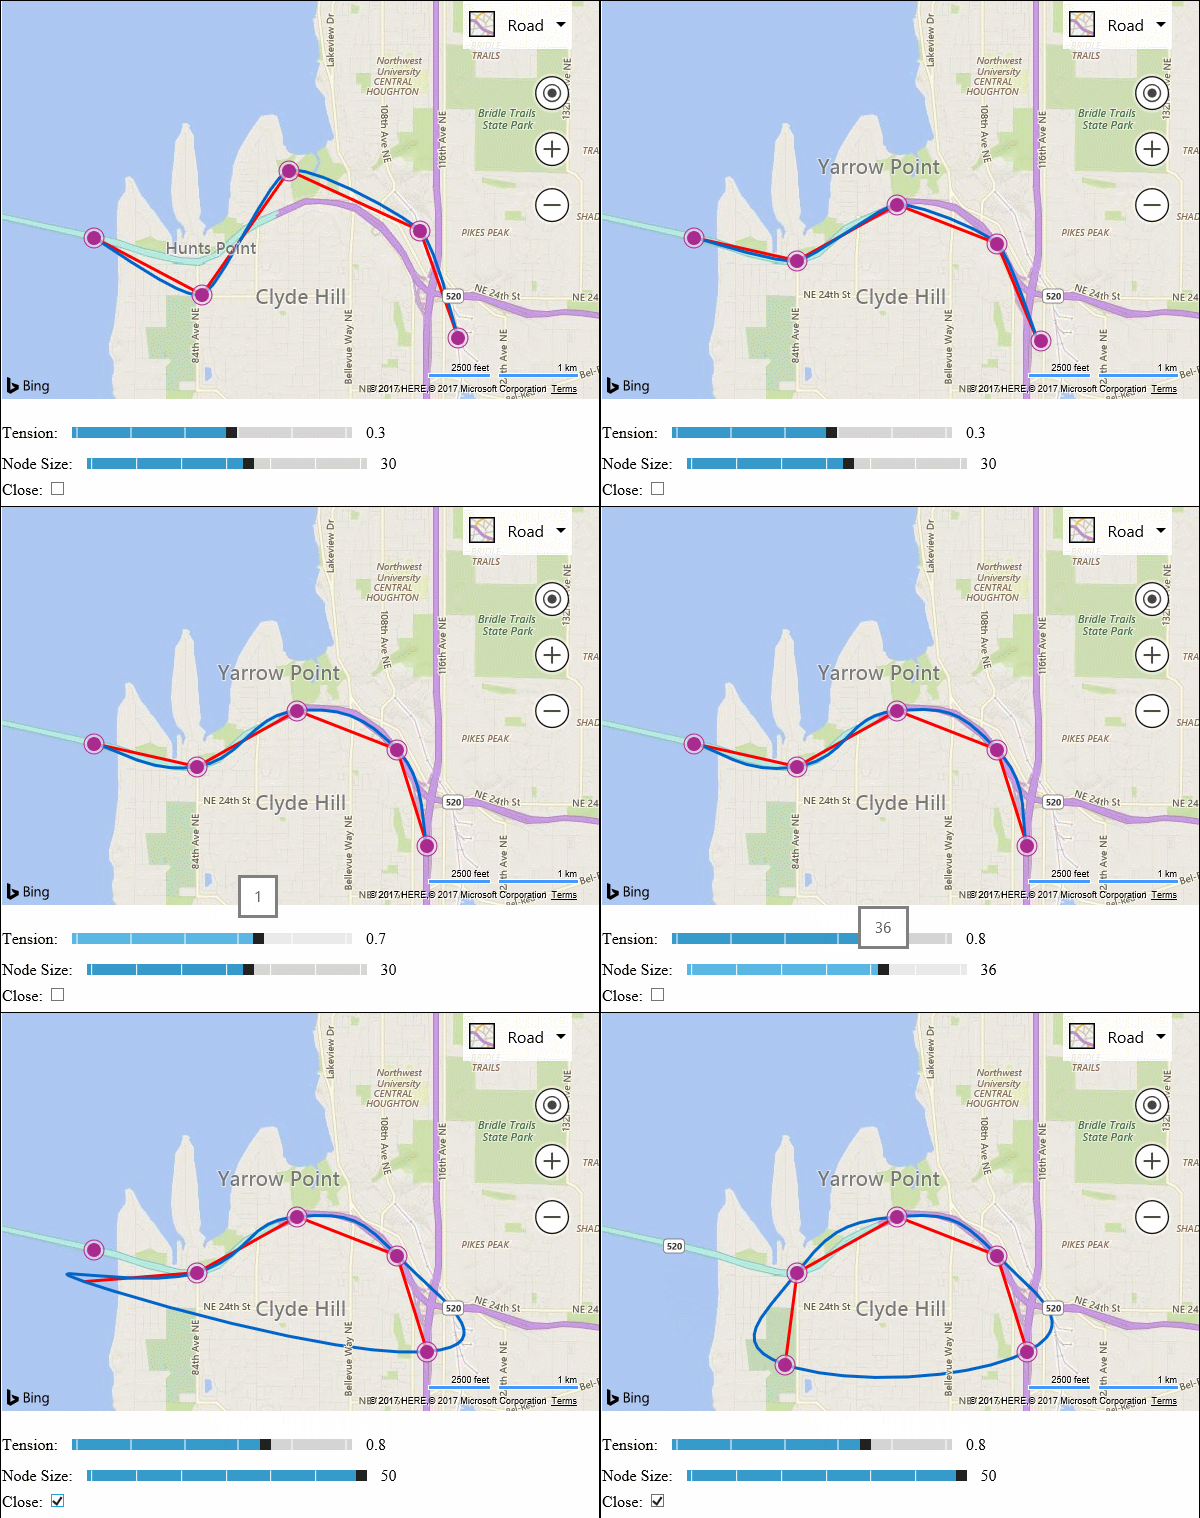
The following code sample demonstrates all the features of the Cardinal Spline function that is available in the Spatial Math module of Bing Maps V8. The red line is a standard polyline connecting the pushpins while the blue line is the cardinal spline. Drag the pushpins, change the tension and node size to see how the cardinal spline changes.

Try it now | Source Code

Join the fun

Have a great code sample or idea for one? Submit it to the Bing Maps V8 Code Samples project on GitHub and make it available to others.

Related Posts

Live Unit Testing in Visual Studio 2017 Enterprise

$
0
0

Live Unit Testing is present in the Enterprise edition of Visual Studio 2017 and it’s available for C# and VB projects that target the .NET Framework. This is a more comprehensive blog than the one we published in November. In this blog, we focus on all capabilities including some that were not mentioned in the earlier blog. It also includes an updated video that demos all these capabilities. FAQsare covered as well at the end.

This is a productivity feature, which provides real-time feedback directly in the editor on how code changes are impacting your unit tests and your code coverage. This will help you maintain quality by keeping the tests passing as you make changes. It will also remind you when you need to write additional unit tests as you are making bug fixes and adding features.

The Live Unit Testing capabilities in Visual Studio 2017 Enterprise are highlighted below:

image1-live-unit-testing

Easy to Start, Stop, Pause or Restart

To enable Live Unit Testing, go to the Test command of the top-level menu bar, choose “Live Unit Testing”, then “Start”:

image2-live-unit-testing-start

At any time, you can temporarily pause or completely stop Live Unit Testing; for example, when you are in the middle of a refactoring, and you know that your tests will be broken for a while. It is as simple as opening the Test menu, selecting Live Unit Testing, and choosing one of the following options:

  • Pause to suspend Live Unit Testing. When Live Unit Testing is paused, you do not see any coverage visualization in the editor, but all the data that is collected so far is preserved. When you are ready to resume, select Continue from the Live Unit Testing menu. Live Unit Testing will do the necessary work to catch up with all the edits that have been made while it was paused and will update the glyphs appropriately.
  • Stop to completely stop Live Unit Testing. When Live Unit Testing is started after it had been stopped, it takes longer to show the glyphs than when it was paused and resumed. This is because it loses all data when it is stopped.
  • Restart is the equivalent to selecting Stop and immediately selecting Start to start Live Unit Testing again.

View coverage information in the editor as you type

Once enabled, Live Unit Testing helps you quickly see whether the code you’re writing is covered and if the tests that cover it are passing without leaving the editor.  Unit test results and coverage visualizations appear on a line-by-line basis in the code editor.

There are three potential states for any given line:

image4-live-unit-testing-coverage-state-redcrossA line of executable code that is covered by at least one failing test is decorated with a red “x”.
image5-live-unit-testing-coverage-state-greencheckA line of executable code that is covered by only passing tests is decorated with a green “✓”.
image6-live-unit-testing-coverage-state-bluedashA line of executable code that is not covered by any test is decorated it with a blue dash “-”

Live Unit Testing coverage visualization is updated immediately as you modify code in the code editor. While processing the edits, visualization changes to indicate that the data is not up-to-date, as shown below. Once processing is done, it transitions to one of the final states described earlier:

Quickly navigate to failed test

At any point in time you can hover over the “✓” or “x” to see how many tests are hitting the given line, as seen in image below:

image10-live-unit-testing-mouse-hover-tool-tip

To see what tests are exercising the given line, click on “✓” or “x”.

image11-live-unit-testing-mouse-click-tool-tip

When you hover over the failed test in the tool tip, it expands to provide additional info to give more insight into the failure:

image12-live-unit-testing-mouse-hover-over-test

To navigate directly to the failed test, click on it in the expanded UI.

Seamlessly debug failed test, edit and continue without having to restart

From the failed test, you can easily debug to the product code, make edits, and continue, without having to pause or stop Live Unit Testing. However, if you want Live Unit Testing to pause when you are debugging then there is an option in Tools/Options page, as shown in section 7 below, for Live Unit Testing to do that.

Include/Exclude targeted test methods or projects for large solutions

Live unit testing enables you to avoid the overhead of continuously running the unit tests for code that you aren’t touching or affecting, especially when you are dealing with a large code base. When you enable Live Unit Testing on a solution with 10 or more projects, you will see a dialog box, that gives a choice to include all or exclude all projects:

image13-live-unit-testing-large-solution

If you select Yes, you get coverage for all projects. If you select No, then Live Unit Testing excludes all projects from Live Unit Testing. You can then go ahead and include targeted tests, by right clicking a test project in solution explorer and choosing Live Tests/Include:

image14-live-unit-testing-include-exclude

The smallest unit of inclusion in or exclusion from Live Unit Testing is a test method.

You can also include or exclude tests by right-clicking in the code editor:

  • If you right click anywhere inside the method then that method can be included or excluded.
  • If you right click outside the method body but somewhere inside the containing class, then all tests inside that class can be included or excluded.
  • If you right click outside the class but somewhere inside the file, then all tests in that file can be included or excluded.

The last include/exclude action always wins. If you had explicitly excluded some tests within a class and go back to it later and include the entire containing class, then all tests inside that class will get included. This includes the tests that were previously explicitly excluded.

Include/Exclude state is saved as a user setting and is remembered when a solution is closed and reopened.

See FAQs section below for more information on how to exclude tests.

Integrated with Test Explorer

The Test Explorer Window and Live Unit Testing are synchronized. As you change your code, Live Unit Testing runs the impacted tests, and only those Tests are shown bright in the Test Explorer Window. The non-impacted tests are dimmed out as shown in image below:

image15-live-unit-testing-test-explorer-integration

Configurable with Tools/Options/Settings

To configure the available options for Live Unit Testing go to Visual Studio’s Options from the Tools menu, and select Live Unit Testing in the left pane of the Options dialog. The configurable options include:

  • Whether Live Unit Testing runs automatically when a solution is opened.
  • Whether Live Unit Testing pauses when a solution is built and debugged, or when a system’s battery power falls below a specified threshold.
  • The interval after which a test case times out; the default is 30 seconds.
  • The number of test processes that Live Unit Testing would create.
  • The Live Unit Testing log information written to the output window. Options include no logging (None), error messages only (Error), error and informational messages (Info – this is the default), or all detail (Verbose).

image16-tools-options

Adaptable to work with three popular unit testing frameworks

Live Unit Testing in Visual Studio works with three popular unit testing frameworks: MSTest, xUnit.net, and NUnit. The adapters and frameworks referenced in every project in the solution must meet or exceed the minimum versions given below else Live Unit Testing will give an error. You can get these from NuGet.org.

Test FrameworkVS Adapter VersionFramework version
xUnit.netxunit.runner.visualstudio version 2.2.0-beta3-build1187xunit 2.0
NUnitNUnit3TestAdapter version 3.5.1NUnit version 3.5.0
MSTestMSTest.TestAdapter 1.1.4-previewMSTest.TestFramework 1.0.5-preview

If you have older adapter and test framework references from your existing projects, be sure to remove them (make sure you remove the reference to Microsoft.VisualStudio.QualityTools.UnitTestFramework, if you are using MSTest.)  and add the new ones for Live Unit Testing to work.

FAQs

You can find latest Live Unit Testing FAQs on our MSDN documentation wiki.

Q: Does Live Unit Testing work with .NET Core?

A:  Live Unit Testing currently does not work with .NET Core. We are working to add this support in future.

Q: Why doesn’t Live Unit Testing work when I turn it on?

A: Output Window (when Live Unit Testing drop down is selected) should tell you why Live Unit Testing is not working. Live Unit testing may not work because of one of the following reasons:

  • If NuGet packages referenced by the projects in the solution have not been restored, then Live Unit Testing will not work. Doing an explicit build of the solution or restoring NuGet packages on the solution before turning Live Unit Testing on should resolve this issue.
  • If you are using MSTest-based tests in your projects, make sure that you remove the reference to Microsoft.VisualStudio.QualityTools.UnitTestFramework and add references to the latest MSTest NuGet packages (see above under the “Adaptable to work with three popular unit testing frameworks” section).
  • At least one project in your solution should have either a NuGet reference or direct reference to xUnit, NUnit or MSTest test framework. This project should also reference corresponding VS test adapters NuGet package. VS test adapter can also be referenced through a .runsettings file. The .runsettings file will need to have an entry like the one below:


<TestAdaptersPaths>c:\Path\To\Your\TestAdapter\TestAdaptersPaths>

Q:Can I customize my Live Unit Testing builds?

A: If your solution requires custom steps to build for instrumentation (Live Unit Testing) that are not required for the “regular” non-instrumented build, then you can add code to your project or .targets files that checks for the BuildingForLiveUnitTesting property and performs custom pre/post build steps. You can also choose to remove certain build steps (like publishing or generating packages) or to add build steps (like copying prerequisites) to a Live Unit Testing build based on this project property. This will not alter your regular build in any way and will only impact Live Unit Testing builds. For e.g., there may be a target which produces NuGet packages during a regular build. You probably do not want NuGet packages to be generated after every edit you make. So, you can disable that target in Live Unit Testing build by doing something like the following:


Q: Why do I get the following error when Live Unit Testing tries to build my solution “… appears to unconditionally set ‘’ or ‘’. Live Unit Testing will not execute tests from the output assembly”?

A: This can happen if the build process for your solution unconditionally overrides the or such that it does not fall under . In such cases, Live Unit Testing will not work because it also overrides these to ensure that build artifacts are dropped to a folder under . If you must override the location where you want your build artifacts to be dropped in a regular build, then override the conditionally and based on . For e.g. if your build is overriding the as shown below:


$(SolutionDir)Artifacts\$(Configuration)\bin\$(MSBuildProjectName)

Then you can replace it with the text below:


$(SolutionDir)Artifacts\$(Configuration)\bin\$(MSBuildProjectName)\
$(BaseOutputPath)

This ensures that lies within the folder.

Do not override directly in your build process; override instead for build artifacts to be dropped to a specific location.

Q: I want the artifacts of a Live Unit Testing build to go to a specific location instead of the default location under the .vs folder. How can I change that?

A: Set the LiveUnitTesting_BuildRoot user level environment variable to the path where you want the Live Unit Testing build artifacts to be dropped.

Q: How is running tests from Test Explorer window different from running tests in Live Unit Testing?

A: There are several differences:

  • Running or debugging tests from the Test Explorer window runs regular binaries, whereas Live Unit Testing runs instrumented binaries. If you want to debug instrumented binaries, adding a Launch method call in your test method causes the debugger to launch whenever that method is executed (including when it is executed by Live Unit Testing), and you can then attach and debug the instrumented binary. However, our hope is that instrumentation is transparent to you for most user scenarios, and you do not need to debug instrumented binaries.
  • Live Unit Testing does not create a new AppDomain to run tests, but tests run from the Test Explorer window do create a new AppDomain.
  • Live Unit Testing runs tests in each test assembly sequentially, whereas if you run multiple tests from the Test Explorer window and you selected the Run Tests in Parallel button, they will run in parallel.
  • Discovery and execution of tests in Live Unit Testing goes through version 2 of TestPlatform, whereas the Test Explorer window still uses version 1. You should not notice a difference in most cases though.
  • Test Explorer currently runs tests in a single-threaded apartment (STA) by default, whereas Live Unit Testing runs tests in a multithreaded apartment (MTA). To have MSTest tests run in STA in Live Unit Testing, decorate the test method or the containing class with the or attribute that can be found in the MSTest.STAExtensions 1.0.3-beta NuGet package. For NUnit, decorate the test method with the < RequiresThread(ApartmentState.STA)> attribute, and for xUnit, with the attribute.
Q: How do I exclude tests from participating in Live Unit Testing?

A: Please refer to include/exclude functionality mentioned above for user specific setting. This is extremely useful when you want to run a specific set of tests for a particular edit session or to persist your own personal preferences.  For solution specific settings, you can apply the ExcludeFromCodeCoverageAttribute programmatically to exclude methods, properties, classes, or structures from getting instrumented by Live Unit Testing. Additionally, you can also set property to “true” in your project file, to exclude the whole project from getting instrumented. The tests which have not been instrumented will still be run by Live Unit Testing but coverage from those will not be visualized.

You can check if “Microsoft.CodeAnalysis.LiveUnitTesting.Runtime” is loaded in the current AppDomain and disable tests based on that. For e.g. you could do something like the following with xUnit:

[ExcludeFromCodeCoverage]
public class SkipLiveFactAttribute : FactAttribute
{
private static bool s_lutRuntimeLoaded = AppDomain.CurrentDomain.GetAssemblies().Any(a => a.GetName().Name == "Microsoft.CodeAnalysis.LiveUnitTesting.Runtime");
public override string Skip => s_lutRuntimeLoaded ? "Test excluded from Live Unit Testing" : "";
}
public class Class1
{
[SkipLiveFact]
public void F()
{
Assert.True(true);
}
}
Q: Why are Win32 PE headers different in instrumented assemblies built by Live Unit testing?

A: There is a known bug that may result in Live Unit Testing builds failing to embed the following Win32 PE Header data. Tests that rely on these values may fail when executed by Live Unit testing:

  • File Version (specified by AssemblyFileVersionAttribute in code)
  • Win32 Icon (specified by /win32icon: on command line)
  • Win32 Manifest (specified by /win32manifest: on command line)
Q: Why does Live Unit testing keep building my solution all the time even if I am not making any edits?

A: This can happen if the build process of your solution generates code which are part of the solution itself, and your build target files do not have appropriate inputs and outputs specified. Targets should be given a list of inputs and outputs so that MSBuild can perform the appropriate up-to-date checks and determine whether a new build is required. Live Unit Testing will kick off a build whenever it detects that source files have changed. Because the build of your solution generates source files, Live Unit Testing will get into infinite build loop. If, however the inputs and outputs of the target are checked then when Live Unit Testing starts the second build (after detecting the newly generated source files from previous build), it will break out of the loop because the inputs and outputs checks will indicate that everything is up-to-date.

Q: How does Live Unit testing work with the Lightweight Solution Load feature?

A: Live Unit Testing currently doesn’t work well with the Lightweight Solution load feature if all projects in the solution are not yet loaded. You may get incorrect coverage information in such scenarios.

Q: Why does Live Unit Testing does not capture coverage from a new process created by a test?

A: This is a known issue which we were not able to fix in VS 2017 release. It should be fixed in a subsequent update of VS 2017.

Q: Why does nothing happen after I include or exclude tests from Live Test Set?

A: This is a known issue. To work around this, you will need to make an edit on any file after you have included or excluded tests.

Q: Why do I not see any icons in the editor even though Live Unit Testing seems to be running the tests based on the messages in the output window?

A: This will happen if the assemblies that Live Unit Testing is operating upon is not instrumented for any reason. For e.g. Live Unit Testing is not compatible with projects that set false. In this case, your build process will need to be updated to either not set this or change it to false for Live Unit Testing to work.

Q: How do I collect more detailed logs to file bug reports?

A: You can do several things to collect more detailed logs:

  • Go to Tools > Options > Live Unit Testing and change the logging option to verbose. This causes more detailed logs to be shown in the output window.
  • Set the LiveUnitTesting_BuildLog user environment variable to the path of the file you want to use to capture the MSBuild log. Detailed MSBuild log messages from Live Unit Testing builds can then be retrieved from this file.
  • Create a user-level environment variable named VS_UTE_DIAGNOSTICS and set it to 1 (or any value) and restart Visual Studio. Now you should see lots of logging in the Output – Tests tab in Visual Studio.

Conclusion

Live Unit Testing will improve your productivity, test coverage and software quality. .NET developers, check out this feature in Visual Studio 2017. For developers who are part of a team that practices test-driven development, Live Unit Testing gamifies their workflow; in other words, all their tests will fail at first, and as they implement each method, they will see them turn green. It will evoke the same feeling as a nod of approval from your coach, who is watching you intently from the sidelines, as you practice your art!

Watch this Live Unit Testing video, where we demonstrate this feature:


Joe Morris, Senior Program Manager, Visual Studio
@_jomorrisJoe has been with Microsoft for 19 years, with a particular focus on static analysis and developer productivity for the last three years.
Manish Jayaswal, Principal Engineering Manager, Visual Studio

Manish has years of management experience in commercial software development with deep technical expertise in compiler technology, debugger, programming languages, quality assurance and engineering system.

Playable Ads – Acquire Users Who Love to Engage with Your App

$
0
0

We are happy to announce the launch of the preview of Playable Ads in the Windows Dev Center. We have made several ground-breaking enhancements in the way users interact with ads so that developers can acquire the users who are more engaged and proven to be more profitable.

What are Playable Ads?

Let us first understand how the current ad campaigns work. Every time a user clicks on the app install ad, he/she is taken to the Windows store page, leaving the current app to decide whether to install the respective app. The information contained in the product description page is not always complete and the experience a user can get from the actual app usage can potentially differ a lot. This sometimes leads to a quick uninstall if the promise of the product description pages is not met.

Playable Ads are a completely new way for end users to interact with ads and apps. With this capability, end users never leave the current app. The ad click will result in inlineexpandable app streaming: for three minutes, the user can interact with the app as if it’s already installed on his/her device. This gives the user time to decide if he or she wants to install the app. At the end of the streaming session, users can click on a link to install the app if the app experience met expectations.

Difference between Regular Ads and Playable Ads

Why are these ads better?

Playable ads have many advantages for both the end users and developers, some of which are listed below:

  • Users can experience the app live before installing it.
  • Users will not leave the current app context after ad click since these are inline expandable ads.
  • Users can abandon the app stream at any point of time based on the quality of the game. He/she is not blocked until the end of the game play.
  • Developers can create an engaging experience during the first few minutes of a game to better explain its capabilities compared to screenshots.
  • Users who install the game after three minutes of engagement are more inclined to use the game/app than those who just installed the app based on the product description page.

And finally, we believe that users acquired via playable ads will have a higher life time value compared with users acquired through the regular channels.

Great! Do I have to do anything as an app developer?

This is the best part of the feature. As an end developer, you don’t have to do anything! No new packages, nothing. Microsoft does all the background work to give a seamless experience to the end users without you, the developer, having to change anything.

How do I create these ads?

If you haven’t already used the app promotion capability, follow these steps to create a new ad campaign:

  • Click on the “Dashboard” after your log in to your Windows Dev Center account.
  • Click on the “Promotions” tab under the Main menu.
  • Click on “New Campaign” to create a new user acquisition campaign.

If the targeting criteria is set to PC/Tablet for the Device type & Windows 10 as the OS, the creative section will show a new call to action called ‘Try Now.’ All the ad campaigns created with ‘Try Now’ as the call to action are automatically created as ‘Playable Ad’ campaigns on the back-end with app streams.

This feature is currently open under a limited preview. If you are interested in using this capability, please reach us at aiacare@microsoft.com.

The post Playable Ads – Acquire Users Who Love to Engage with Your App appeared first on Building Apps for Windows.

New Features in C# 7.0

$
0
0

Here is a description of all the new language features in C# 7.0, which came out last Tuesday as part of the Visual Studio 2017 release.

C# 7.0 adds a number of new features and brings a focus on data consumption, code simplification and performance. Perhaps the biggest features are tuples, which make it easy to have multiple results, and pattern matching which simplifies code that is conditional on the shape of data. But there are many other features big and small. We hope that they all combine to make your code more efficient and clear, and you more happy and productive.

If you are curious about the design process that led to this feature set, you can find design notes, proposals and lots of discussion at the C# language design GitHub site.

If this post feels familiar, it may be because a preliminary version went out last August. In the final version of C# 7.0 a few details have changed, some of them in response to great feedback on that post.

Have fun with C# 7.0, and happy hacking!

Mads Torgersen, C# Language PM

Out variables

In older versions of C#, using out parameters isn’t as fluid as we’d like. Before you can call a method with out parameters you first have to declare variables to pass to it. Since you typically aren’t initializing these variables (they are going to be overwritten by the method after all), you also cannot use var to declare them, but need to specify the full type:

In C# 7.0 we have added out variables; the ability to declare a variable right at the point where it is passed as an out argument:

Note that the variables are in scope in the enclosing block, so that the subsequent line can use them. Many kinds of statements do not establish their own scope, so out variables declared in them are often introduced into the enclosing scope.

Since the out variables are declared directly as arguments to out parameters, the compiler can usually tell what their type should be (unless there are conflicting overloads), so it is fine to use var instead of a type to declare them:

A common use of out parameters is the Try... pattern, where a boolean return value indicates success, and out parameters carry the results obtained:

We allow "discards" as out parameters as well, in the form of a _, to let you ignore out parameters you don’t care about:

Pattern matching

C# 7.0 introduces the notion of patterns, which, abstractly speaking, are syntactic elements that can test that a value has a certain "shape", and extract information from the value when it does.

Examples of patterns in C# 7.0 are:

  • Constant patterns of the form c (where c is a constant expression in C#), which test that the input is equal to c
  • Type patterns of the form T x (where T is a type and x is an identifier), which test that the input has type T, and if so, extracts the value of the input into a fresh variable x of type T
  • Var patterns of the form var x (where x is an identifier), which always match, and simply put the value of the input into a fresh variable x with the same type as the input.

This is just the beginning – patterns are a new kind of language element in C#, and we expect to add more of them to C# in the future.

In C# 7.0 we are enhancing two existing language constructs with patterns:

  • is expressions can now have a pattern on the right hand side, instead of just a type
  • case clauses in switch statements can now match on patterns, not just constant values

In future versions of C# we are likely to add more places where patterns can be used.

Is-expressions with patterns

Here is an example of using is expressions with constant patterns and type patterns:

As you can see, the pattern variables– the variables introduced by a pattern – are similar to the out variables described earlier, in that they can be declared in the middle of an expression, and can be used within the nearest surrounding scope. Also like out variables, pattern variables are mutable. We often refer to out variables and pattern variables jointly as "expression variables".

Patterns and Try-methods often go well together:

Switch statements with patterns

We’re generalizing the switch statement so that:

  • You can switch on any type (not just primitive types)
  • Patterns can be used in case clauses
  • Case clauses can have additional conditions on them

Here’s a simple example:

There are several things to note about this newly extended switch statement:

  • The order of case clauses now matters: Just like catch clauses, the case clauses are no longer necessarily disjoint, and the first one that matches gets picked. It’s therefore important that the square case comes before the rectangle case above. Also, just like with catch clauses, the compiler will help you by flagging obvious cases that can never be reached. Before this you couldn’t ever tell the order of evaluation, so this is not a breaking change of behavior.
  • The default clause is always evaluated last: Even though the null case above comes last, it will be checked before the default clause is picked. This is for compatibility with existing switch semantics. However, good practice would usually have you put the default clause at the end.
  • The null clause at the end is not unreachable: This is because type patterns follow the example of the current is expression and do not match null. This ensures that null values aren’t accidentally snapped up by whichever type pattern happens to come first; you have to be more explicit about how to handle them (or leave them for the default clause).

Pattern variables introduced by a case ...: label are in scope only in the corresponding switch section.

Tuples

It is common to want to return more than one value from a method. The options available in older versions of C# are less than optimal:

  • Out parameters: Use is clunky (even with the improvements described above), and they don’t work with async methods.
  • System.Tuple<...> return types: Verbose to use and require an allocation of a tuple object.
  • Custom-built transport type for every method: A lot of code overhead for a type whose purpose is just to temporarily group a few values.
  • Anonymous types returned through a dynamic return type: High performance overhead and no static type checking.

To do better at this, C# 7.0 adds tuple types and tuple literals:

The method now effectively returns three strings, wrapped up as elements in a tuple value.

The caller of the method will receive a tuple, and can access the elements individually:

Item1 etc. are the default names for tuple elements, and can always be used. But they aren’t very descriptive, so you can optionally add better ones:

Now the recipient of that tuple have more descriptive names to work with:

You can also specify element names directly in tuple literals:

Generally you can assign tuple types to each other regardless of the names: as long as the individual elements are assignable, tuple types convert freely to other tuple types.

Tuples are value types, and their elements are simply public, mutable fields. They have value equality, meaning that two tuples are equal (and have the same hash code) if all their elements are pairwise equal (and have the same hash code).

This makes tuples useful for many other situations beyond multiple return values. For instance, if you need a dictionary with multiple keys, use a tuple as your key and everything works out right. If you need a list with multiple values at each position, use a tuple, and searching the list etc. will work correctly.

Tuples rely on a family of underlying generic struct types called ValueTuple<...>. If you target a Framework that doesn’t yet include those types, you can instead pick them up from NuGet:

  • Right-click the project in the Solution Explorer and select "Manage NuGet Packages…"
  • Select the "Browse" tab and select "nuget.org" as the "Package source"
  • Search for "System.ValueTuple" and install it.

Deconstruction

Another way to consume tuples is to deconstruct them. A deconstructing declaration is a syntax for splitting a tuple (or other value) into its parts and assigning those parts individually to fresh variables:

In a deconstructing declaration you can use var for the individual variables declared:

Or even put a single var outside of the parentheses as an abbreviation:

You can also deconstruct into existing variables with a deconstructing assignment:

Deconstruction is not just for tuples. Any type can be deconstructed, as long as it has an (instance or extension) deconstructor method of the form:

The out parameters constitute the values that result from the deconstruction.

(Why does it use out parameters instead of returning a tuple? That is so that you can have multiple overloads for different numbers of values).

It will be a common pattern to have constructors and deconstructors be "symmetric" in this way.

Just as for out variables, we allow "discards" in deconstruction, for things that you don’t care about:

Local functions

Sometimes a helper function only makes sense inside of a single method that uses it. You can now declare such functions inside other function bodies as a local function:

Parameters and local variables from the enclosing scope are available inside of a local function, just as they are in lambda expressions.

As an example, methods implemented as iterators commonly need a non-iterator wrapper method for eagerly checking the arguments at the time of the call. (The iterator itself doesn’t start running until MoveNext is called). Local functions are perfect for this scenario:

If Iterator had been a private method next to Filter, it would have been available for other members to accidentally use directly (without argument checking). Also, it would have needed to take all the same arguments as Filter instead of having them just be in scope.

Literal improvements

C# 7.0 allows _ to occur as a digit separator inside number literals:

You can put them wherever you want between digits, to improve readability. They have no effect on the value.

Also, C# 7.0 introduces binary literals, so that you can specify bit patterns directly instead of having to know hexadecimal notation by heart.

Ref returns and locals

Just like you can pass things by reference (with the ref modifier) in C#, you can now return them by reference, and also store them by reference in local variables.

This is useful for passing around placeholders into big data structures. For instance, a game might hold its data in a big preallocated array of structs (to avoid garbage collection pauses). Methods can now return a reference directly to such a struct, through which the caller can read and modify it.

There are some restrictions to ensure that this is safe:

  • You can only return refs that are "safe to return": Ones that were passed to you, and ones that point into fields in objects.
  • Ref locals are initialized to a certain storage location, and cannot be mutated to point to another.

Generalized async return types

Up until now, async methods in C# must either return void, Task or Task. C# 7.0 allows other types to be defined in such a way that they can be returned from an async method.

For instance we now have a ValueTask struct type. It is built to prevent the allocation of a Task object in cases where the result of the async operation is already available at the time of awaiting. For many async scenarios where buffering is involved for example, this can drastically reduce the number of allocations and lead to significant performance gains.

There are many other ways that you can imagine custom "task-like" types being useful. It won’t be straightforward to create them correctly, so we don’t expect most people to roll their own, but it is likely that they will start to show up in frameworks and APIs, and callers can then just return and await them the way they do Tasks today.

More expression bodied members

Expression bodied methods, properties etc. are a big hit in C# 6.0, but we didn’t allow them in all kinds of members. C# 7.0 adds accessors, constructors and finalizers to the list of things that can have expression bodies:

This is an example of a feature that was contributed by the community, not the Microsoft C# compiler team. Yay, open source!

Throw expressions

It is easy to throw an exception in the middle of an expression: just call a method that does it for you! But in C# 7.0 we are directly allowing throw as an expression in certain places:

vswhere now searches older versions of Visual Studio

$
0
0

One of the top requests I kept hearing for vswhere was to also search older versions of Visual Studio. You can now do that starting with the latest release.

vswhere -legacy -latest -property installationPath

Even if you don’t have Visual Studio 2017 or newer installed – which means the query API is not even registered – you can use vswhere to find the installation root directory for Visual Studio 2010 and newer.

There are some caveats:

  • You cannot also specify the -products or -requires parameters.
  • Information returned is very limited. While there are a few more properties I could scavenge, the scenario that prompted the requests was to find the location.

[
{
"instanceId": "VisualStudio.14.0",
"installationPath": "C:\\Program Files (x86)\\Microsoft Visual Studio 14.0\\",
"installationVersion": "14.0"
}
]

All the other vswhere parameters that control the output format and selection still work. For example, if you wanted to find the path to the latest version of VS2010 through VS2014.

$path = vswhere -latest -version '[10.0,15.0)' -property installationPath
if (test-path "$path\Common7\IDE\devenv.exe") {& $path $args
}

Once the new version is moderated on Chocolatey.org you can acquire it quickly using choco or PowerShell’s install-package.

For rich information about instances, I recommend you use the VSSetup PowerShell module. These support deeper analysis of instances and is designed to work only with Visual Studio 2017 and newer, or related products such as Build Tools.

Nintendo Switch and The Legend of Zelda: Breath of the Wild are an ABSOLUTE JOY

$
0
0

I bought a Nintendo Switch last week with my allowance and I'm utterly smitten. It's brilliant. It's absolutely brilliant.

The Nintendo Switch is FAB

Now, to be clear, I'm neither a hardcore gamer nor a journalist. However, I am someone who grew up on Mario, enjoys Retrogaming and my Xbox One, and most of all, I know genius when I see it.

The Legend of Zelda: Breath of the Wild is a wonderful example of the very best that video games can offer as an art form in 2017.

It may be the best video game ever. And it is because it borrows so much from the decades of refinement whose shoulders it stands upon.

Let's break this down into two halves. First, Zelda (which is available on WiiU and Switch), and later, the Switch itself.

If you don't feel like reading this, just trust me and buy a Switch and Zelda and bask in the hundreds of hours of joy and wonder it will bring you. It's the most fun I've had with a video game in recent memory. I also profoundly recommend the gorgeous hardcover The Legend of Zelda: Breath of the Wild: The Complete Official Guide Collector's Edition. The maps, the art, and the gentle walkthroughs are more fun than googling. The kids and I have enjoyed exploring the wilderness with the giant map unfurled in front of us.

Legend of Zelda: Breath of the Wild

It's HUGE. It's estimated at 360 square kilometers. They are saying it's 1.5x the Skyrim map and may be larger than Witcher 3. A cynic could call Breath of the Wild derivative, but an optimist like me says, well, they stole every game mechanic that was awesome over the last few decades, and made the near-perfect game. I love that this is a console launch game that is polished and has at LEAST 100 hours or more for the completist.

Zelda is gorgeousWhat is Zelda like?

  • Just Cause - Fly off a cliff with a paraglider, fly over a raging river and land on an elk, tame it and ride it. Because you're awesome and you can.
  • Witcher 3 - Massive map, armor sets, crafting and more.
  • Assassin's Creed - Climbing because...it's fun. Getting maps by unlocking towers and jumping off.
  • Grand Theft Auto - The first massive sandbox without loading. You enter a new area and get a brief subtitle announcing you're in a new "neighborhood" and then you wander.
  • Skyrim - The Elder Scrolls was the first video game I played where I climbed mountains "because they were there" and really had a sense of wonder when I got to the top. Draw distance!
  • Shadow of the Colossus - There's amazing HUGE boss fights that involve climbing the enemy, racing after monsters with horses, and sometimes going inside them.
  • Bard's Tale - Because I'm old.

Complaints? Honestly, if I had to truly nit. And I mean really nit I'd say the durability of weapons, particularly swords, is annoying. I would make them last maybe 50% longer. Also, moving in and out of Shrines has a load screen that takes 10-15 seconds. But really, that's like saying "I wish Beyoncé was 5'8", not 5'7". I mean, REALLY. Beyoncé. Shush.

The Nintendo Switch

It's portable. Just like in the ad, you can pull the Switch out and leave. In my video below I also switch to portable AND have to re-sync the controllers, so there is one additional ceremony, but it's easy.

It feels like a console when it's plugged in. I've got it plugged into my TV and from my couch it looks as nice as any of my devices. Sure, it's not an Xbox One playing Tom Clancy: The Division. But it's a brilliant tradeoff for a device I can simply pick up and go outside with (which I've done, with considerable appreciation.)

I'm surprised that folks are complaining about the gaming resolution, frame rates, battery life, older processor, or said "it's just like an iPad with an HDMI cable." Here's why:

  • Resolution - Zelda runs at 720p (the native res of the touchscreen) at 30fps. It's just 6.5" and 720p is just fine when it's a foot or more from your face.
  • Battery - I got an easy 3 hours out of it. If you're on a plane, carry a cable and extra battery. If you need to portably game more than 3 hours, take a break. ;) Seriously, though, given my appreciation of it's portability and power and experience this is reasonable. One can always complain about battery life.
  • Frame Rate - When you dock the Switch and run Zelda over your TV the resolution is 900p and sometimes it lags. If you're in the forest, and it's raining, and there's a bunch of enemies around there will totally be moments of 20 fps. But it passes. And it's still gorgeous. A small price to pay, and we don't know if it's fixable with a software patch. Given that launch titles rarely use the new hardware in an optimized fashion, it's more than reasonable to give them a break on this.
  • Older Processor - The Switch is using the older Nvidia Tegra X1 processor. As a business person this makes sense. It's a $300 device. It's not reasonable to expect all day battery life and 4k gaming on a device that weights two-thirds of a pound.
  • Innovation - Yes, you can plug your iPad into your TV. But most folks don't. And the iPad and iOS clearly haven't tried to optimize for this scenario. Apple has scandalously under-supported their MFi Controller Spec, even though the SteelSeries is brilliant. Frankly, Apple handed Nintendo a huge opportunity by not making a proper controller and supporting MFi better with Game Devs. The Switch might not exist if I could BlueTooth Pair any controller to my iPad and play Skyrim on an iPad. Oh ya, I'd have to have an iPad with expandable memory or a cartridge slot. ;) The Switch is a new category of device. It's not an iPad.

It's a fantastic device for the price and the promises, for the most part, were kept. That said, a few gentle warnings if you do get a Switch.

  • If you put the joy-cons on backwards they might get stuck and you could perhaps damage the system.
  • The joy-cons have these little wrist straps as well, and to be clear if you put these on backwards you're in trouble. Make sure you line up the plus + signs. There's a + on the right joy-con and a - on the left one. Use the correct strap for the correct joy-con.
  • If you slam the Switch into the dock it's possible you could scratch the screen. I always tweet $300 equipment like it cost $300. Be somewhat careful.

My Recommended Nintendo Switch accessories (I own each of these)

These accessories are by no means required (the Switch has everything you need out of the box) but these are all 4+ star rated and I've purchased them myself and appreciate them. Yes, I've gone overboard and my $300 Switch is now a $500 Switch BUT I HAVE NO REGERTS. ;)

  • Some kind of Carrying Case. I have the Zelda Special Edition case, but all the cases that are official Nintendo are excellent.
  • The Nintendo Switch Pro Controller. If you're going to hook your Switch up to the TV you might consider the pro controller. The Switch does come with a quasi-controller that has you pop the two joy-cons into a harness to simulate a typical Xbox/PS Controller but the ergonomics are exact by any stretch. The Pro Controller is fantastic. It's 99% the same as an Xbox Controller and includes (quietly) the full 360 degree gyro support that (I believe) Switch Games will be known for (see the second above on gyro in Zelda.)
  • Joy-con Grips. This was a frivolous purchase but a good one. I've got big hands and the Joy-Cons are NOT comfortable when turned horizontally and used for any period of time. These little holsters turn them into tiny Pro Controllers and make two player a LOT easier.
  • Compact Playstand. The Switch has one major hardware design "flaw" in that it can't be charged while it's using its kickstand. This little folding playstand is nice because it's 3-in-1 and can also perfectly fit a 3DSXL.
  • Large 128g EXTRA-FAST microSDXC SD Card. The Switch has only 32gigs of internal space and if you (theoretically) downloaded Zelda you'll use 13gigs. I can see myself using up a LOT of space in the next year so I got this 128G SD Card. And it's FAST.
  • 6 pack of Microfiber Cleaning Cloths  - I can't stand a dirty touchscreen. Can't. I have two dozen of these spread around the house, my car, my backpack. Can't have too many given laptops, TVs, and iPads.
  • USB C cables - Both the Switch and Pro Controller use USB C (finally!) so pick up a few USB C cables that you can use to charge in a pinch from your laptop, existing car charger, or portable battery. I only buy Anker Batteries.
  • A Zelda Amiibo - Amiibos are these little figurines with an RFID/NFC dealie inside. They are registered to you and they can "light up" features in all kinds of games. In Zelda specifically you can (a little later in the game) use them to get daily food and other bonuses. Plus they look nice on your desk.

My Predictions for the Nintendo Switch in 2017

I'm looking forward to seeing what the Nintendo Switch can become. I think/predict we'll see this on the Switch in 2017.

  • A thrilling Indie Game Community. Yes, the launch titles are weak. There aren't a ton of launch games. Call it a soft launch. But give it a few months.
  • Virtual Console - The ability to play SNES/NES and other games via some kind of emulation from Nintendo. We have already seen NEO-GEO games show up in the last few days! I can imagine we'll see a Mario Collection going back 30+ years.
  • Video Apps - If they add Hulu, Netflix, and Amazon, then I'll be taking my Switch with me to
  • A USB-C to HDMI cable - I don't want to take the dock with me on trips, so I'd love a USB-C to HDMI cable from Nintendo (It'll need their magic box/chip) to free up my bag.
  • A great balance between AAA Games and "classic" games. If Zelda and Shovel Knight are any indication, the future is bright.
  • Continued updates to the online experience. I suspect we'll get firmware and store updates quarterly.

But at the same time, what's the nightmare scenario? Nothing happens. No games come out and I have a $500 Zelda-specific device. I'm totally OK with that give the joy of the last week. So between the worst-case scenario and the best case, no matter what happens it's awesome and I'm a satisfied customer.

* I've used Amazon referral links here. Please use them and you'll support this blog and my Amiibo Habit.


Sponsor: Get next level application monitoring with Raygun - The revolutionary software intelligence platform for your web and mobile apps. Take a free trial today


© 2017 Scott Hanselman. All rights reserved.
     

Build a Smarter Bracket with Bing

$
0
0

March means three things.

  1. Spring is soon to be sprung.
  2. It’s time to focus solely on college hoops.
  3. Build a better bracket with Bing Predicts.

We've been using Bing Predicts for the bracket selection process for two years now, and in that time, we've learned a few things.

Bing Predicts may be the magic ingredient for making all your bracket dreams happen. We use our intelligent machine-learning technology to analyze social and search signals, plus more than a decade of college hoops statistical data to bring you insights on every single one of your picks.

Bing March Madness

There are quintillions of ways to fill out a bracket, so we want to bring some intelligence into the often overwhelming decision making process. Here's how it works:

  • When selecting your first round matchups, use the Bing predictions to help guide your choices
  • In every subsequent pick for every subsequent round, the Bing models give suggestions and forecasts based on who you picked in the prior round. Even after the tournament starts, Bing will still provide predictions for matches in the round of 16

Our smarter bracket can work its magic on your phone as well with a fantastic mobile bracket experience. Download the Bing app and search “March Madness” to start swiping away at your bracket.

Want to use a bot to keep track of your teams? Follow them with the Bing Sportscaster bot on Facebook Messenger for news and game updates.

Good luck this March. We understand the agony involved in getting your bracket just right. If Bing Predicts can take a bit of the madness away, then we did our job.

- The Bing Team

Helping new customers get oriented, keeping our content up-to-date

$
0
0

We’re always working to keep our content as fresh and accurate as possible.

We have some new content that we’d like to highlight and hopefully have you spread the word.

On-boarding content for newcomers

We recently wrote a set of overview topics to help orient visitors new to Team Services and TFS. These topics provide a framework for newbies to understand how our supported set of platforms, services, clients, and Marketplace extensions fit together to support software development teams.

You can view these topics here:

Collaborate content

We’ve recently introduced a new area to highlight content that spans features and scenarios that support team collaboration. This content supports team collaboration across the traditional hubs of Code, Work, Build & Release, and Test. Which is why we’ve named this area Collaborate.

Under the Collaborate section, you’ll find content that supports sharing information, getting notification, and supporting team chat. Here’s a few of the new topics in this area:

Content updates

We also want to take this opportunity to point out the Content updates topic that we update with the release of new features every three weeks. This topic provides an index to release notes, blog posts, and content related to DevOps working with Team Services and TFS.

We started back in March 2016 and are now working are way through 2017.

We work to highlight topics that are brand new–usually covering new features or scenarios and significantly updated topics.

We appreciate your feedback and ratings

Your feedback and insights can help us better focus on where we should focus to address missing scenarios or to simply correct a typo or error.

As you review a topic, please rate it and leave a note of what works well or what’s missing.

We thank you,

Kathryn

Visual Studio 2017 Poster

$
0
0

Since we launched Visual Studio 2017 last week, hundreds of thousands of customers like you have already installed and started using Visual Studio 2017, and we’re excited to see what you create. Visual Studio 2017 contains so many new features. From productivity enhancements to new C++ capabilities. Start using our ASP.NET Core Tooling along with Live Unit Testing. Explore C# 7 and our new database DevOps features that help improve your productivity.

We thought it would be fun to put together a poster that shows off some of our favorite parts of Visual Studio 2017. You’ll also see some helpful tips and tricks to improve your productivity!

visualstudio2017_productlaunchposter-1

Go ahead and download this poster as a PDF, hang it up in your team room or wherever you code and tweet us a picture at @VisualStudio with the caption . We also have a web infographic version, and if you just need a cheat sheet of handy keyboard shortcuts, you can just download that page for easy printing.

A quick reminder – we’d love your feedback on Visual Studio 2017. If you run into an issue, you can Report-a-Problem directly from within Visual Studio to our Developer Community. We are always listening so you can also submit suggestions or feature ideas to be considered on our UserVoice.

Tim Sneath, Principal Lead Program Manager, Visual Studio

Tim leads a team focused on Visual Studio acquisition and extensibility. His mission is to see developers create stunning applications built on the Microsoft platform, and to persuade his mother that her computer is not an enemy. Amongst other strange obsessions, Tim collects vintage releases of Windows, and has a near-complete set of shrink-wrapped copies that date back to the late 80s.

What’s new with IncrediBuild and Visual Studio 2017

$
0
0

As a part of Visual Studio 2015 release, we introduced a partnership between IncrediBuild and Visual Studio. This partnership allowed developers to install IncrediBuild from the Build Accelerator menu and benefit from a few key build acceleration features free of charge.

Based upon the feedback we have heard, with Visual Studio 2017, we have made some changes to this experience which are as follows.

Install IncrediBuild from the Visual Studio Installer

Once you have downloaded the Visual Studio 2017 installer, IncrediBuild is presented as an optional component for C++ workloads namely ‘Desktop development with C++’, ‘Mobile development with C++’ and ‘Game development with C++’.

The figure below depicts the IncrediBuild optional component presented as part of the ‘Desktop Development with C++ workload’.

incredibuild

To install IncrediBuild just check the IncrediBuild optional component and then just wait and watch.

It should not take too long for the installation to complete and once it has been completed you can go ahead and build your first C++ application with IncrediBuild and Visual Studio 2017.

Increased Parallelization for your builds

Another change we have made with Visual Studio 2017 release is that the IncrediBuild build engine will now parallelize your build for up to 16 cores vs. the 8 cores limit in Visual Studio 2015 at no additional cost This would help further improve your build time when using IncrediBuild with Visual Studio 2017.

Tell us what you think

Download Visual Studio 2017, try out the IncrediBuild Visual Studio integration, and let us know what you think. You can report problems by clicking the user feedback icon next to Quick Launch in the title bar and then selecting . Track your feedback on the developer community portal. For suggestions, let us know through User Voice. We look forward to hearing from you!


TFS 2015 Update 4 Preview

$
0
0

I know this comes close on the heels of shipping TFS 2017 Update 1, but we are working on another Update to TFS 2015.  For those who are up for it, I encourage you to upgrade to TFS 2017 Update 1, however, if there are reasons you really want to stay on 2015 a little longer, Update 4 might be useful to you.

Update 4 only contains bug fixes.  It has about 25 bug fixes, all or most of which, have been reported by customers.  They were all selected because they seemed likely enough and problematic enough to warrant issuing a proactive fix.

I really believe this is the last Update for the TFS 2015 product.  From this point forward, all releases will be on TFS 2017 and later unless something really surprising happens.

Let us know if you have any issues with it.

Thanks,

Brian

Viewing all 10804 articles
Browse latest View live


<script src="https://jsc.adskeeper.com/r/s/rssing.com.1596347.js" async> </script>