Quantcast
Channel: Category Name
Viewing all 10804 articles
Browse latest View live

Azure Cloud Shell – your own bash shell and container – right inside Visual Studio Code

$
0
0

Visual Studio Code has a HUGE extension library. There's also almost two dozen very nice Azure specific extensions as well as extensions for Docker, etc. If you write an Azure extension yourself, you can depend on the Azure Account Extension to handle the administrivia of the user logging into Azure and selecting their subscription. And of course, the Azure Account Extension is open source.

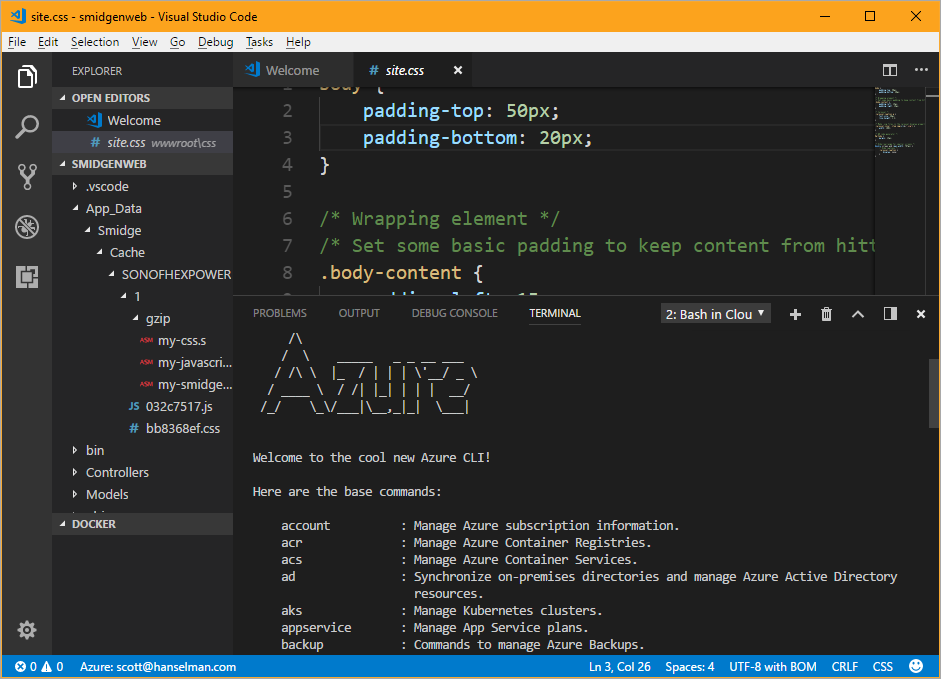
Here's the cool part - I think, since I just learned it. You can have the Azure Account Extension installed (again, you can install it directly or you can get it as a dependency) you also get the ability to get an Azure Cloud Shell directly inside VS Code. That means a little container spins up in the Cloud and you can get a real bash shell or a real PowerShell shell quickly. AND the Azure Cloud Shell automatically is logged in as you and already has a ton of tools pre-installed.

Here's how you do it.

VS Code Command Palette

It will pop up a message with a "copy & open" button. It'll launch a browser, then you enter a special code after logging into Azure to OAuth VS Code into your Account account.

image

At this point, open a Cloud Shell with Shift-Ctrl-P and type "Bash" or "PowerShell"...it'll autocomplete so you can type a lot less, or setup a hotkey.

Your Cloud Shell will appear along side your local terminals!

Azure Cloud Shell in VS Code

Note that there's a "clouddrive" folder mapped to your Azure Storage so you can keep stuff in there. Even though the Shell goes away in about 20 min of non-use, your stuff (scripts, whatever) is persisted.

image

There's a bunch of tools preinstalled you can use as well!

scott@Azure:~$ node --version

v6.9.4
scott@Azure:~$ dotnet --version
2.0.0
scott@Azure:~$ git --version
git version 2.7.4
scott@Azure:~$ python --version
Python 3.5.2
scott@Azure:~$ lsb_release -a
No LSB modules are available.
Distributor ID: Ubuntu
Description: Ubuntu 16.04.2 LTS
Release: 16.04
Codename: xenial

And finally, when you type "azure" or "az" for the various Azure CLI (Command Line Interface) tools, you'll find you're already authenticated/logged into Azure, so you can create VMs, list websites, manage Kubenetes clusters, all from within VS Code. I'm still exploring, but I'm enjoying what I'm seeing.


Sponsor: Scale your Python for big data & big science with Intel® Distribution for Python. Near-native code speed. Use with NumPy, SciPy & scikit-learn. Get it Today


© 2017 Scott Hanselman. All rights reserved.
     

Accelerated 3D VR, sure, but impress me with a nice ASCII progress bar or spinner

$
0
0

I'm glad you have a 1080p 60fps accelerated graphics setup, but I'm old school. Impress me with a really nice polished ASCII progress bar or spinner!

I received two tips this week about cool .NET Core ready progress bars so I thought I'd try them out.

ShellProgressBar by Martijn Laarman

This one is super cool. It even supports child progress bars for async stuff happening in parallel! It's very easy to use. I was able to get a nice looking progress bar going in minutes.

static void Main(string[] args)

{
const int totalTicks = 100;
var options = new ProgressBarOptions
{
ForegroundColor = ConsoleColor.Yellow,
ForegroundColorDone = ConsoleColor.DarkGreen,
BackgroundColor = ConsoleColor.DarkGray,
BackgroundCharacter = 'u2593'
};
using (var pbar = new ProgressBar(totalTicks, "Initial message", options))
{
pbar.Tick(); //will advance pbar to 1 out of 10.
//we can also advance and update the progressbar text
pbar.Tick("Step 2 of 10");
TickToCompletion(pbar, totalTicks, sleep: 50);
}
}

Boom.

Cool ASCII Progress Bars in .NET Core

Be sure to check out the examples for ShellProgressBar, specifically ExampleBase.cs where he has some helper stuff like TickToCompletion() that isn't initially obvious.

Kurukuru by Mayuki Sawatari

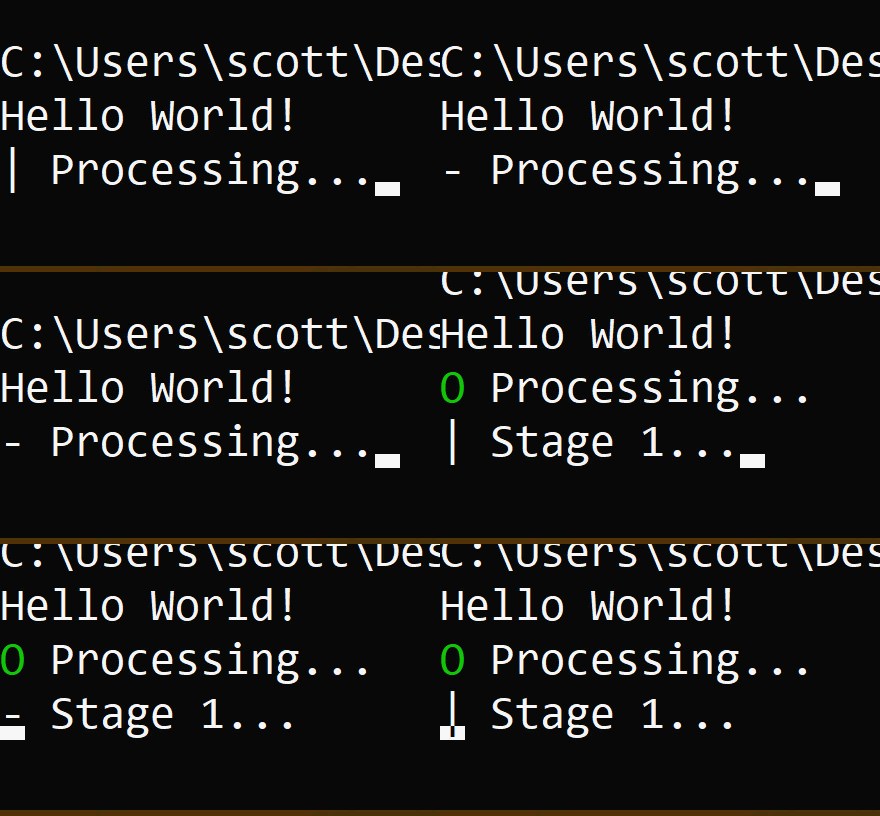
Another nice progress system that is in active development for .NET Core (like super active...I can see they updated code an hour ago!) is called Kurukuru. This code is less about progress bars and more about spinners. It's smart about Unicode vs. non-Unicode as there's a lot of cool characters you could use in a Unicode-aware console that make for attractive spinners.

What a lovely ASCII Spinner in .NET Core!

Kurukuru is also super easy to use and integrated into your code. It also uses the "using" disposable pattern in a clever way. Wrap your work and if you throw an exception, it will show a failed spinner.

Spinner.Start("Processing...", () =>

{
Thread.Sleep(1000 * 3);

// MEMO: If you want to show as failed, throw a exception here.
// throw new Exception("Something went wrong!");
});

Spinner.Start("Stage 1...", spinner =>
{
Thread.Sleep(1000 * 3);
spinner.Text = "Stage 2...";
Thread.Sleep(1000 * 3);
spinner.Fail("Something went wrong!");
});

TIP: If your .NET Core console app wants to use an async Main (like I did) and call Kurukuru's async methods, you'll want to indicate you want to use the latest C# 7.1 features by adding this to your project's *.csproj file:

<PropertyGroup>
    <LangVersion>latest</LangVersion>
</PropertyGroup>

This allowed me to do this:

public static async Task Main(string[] args)

{
Console.WriteLine("Hello World!");
await Spinner.StartAsync("Stage 1...", async spinner =>
{
await Task.Delay(1000 * 3);
spinner.Text = "Stage 2...";
await Task.Delay(1000 * 3);
spinner.Fail("Something went wrong!");
});
}

Did I miss some? I'm sure I did. What nice ASCII progress bars and spinners make YOU happy?

And again, as with all Open Source, I encourage you to HELP OUT! I know the authors would appreciate it.


Sponsor: Check out JetBrains Rider: a new cross-platform .NET IDE. Edit, refactor, test and debug ASP.NET, .NET Framework, .NET Core, Xamarin or Unity applications. Learn more and download a 30-day trial!


© 2017 Scott Hanselman. All rights reserved.
     

Lift, shift, and modernize using containers on Azure Service Fabric

$
0
0

Azure Service Fabric is a distributed systems platform that is the foundational technology powering core Azure infrastructure, as well as other Microsoft services such as Skype for Business, Azure Cosmos DB, Azure SQL Database, Dynamics 365, Cortana, and many more. It makes building and managing scalable microservices and container applications for Windows and Linux easy. Service Fabric has supported container orchestration for production scenarios for several months now with the general availability announcement for Windows Server 2016 at Microsoft Build and Ubuntu Linux 16.04 at the Ignite conference. At Ignite, we demonstrated the scheduling, placement of a million containers on a cluster spanning 3500 nodes in under two minutes, which meant that you never have to worry about performance and scale with Service Fabric. We’ll have a more detailed post on this coming soon.

In this post, we’ll call out some of the container orchestration capabilities in Service Fabric along with a peek at what’s coming soon. Many customers are looking at lift-and-shift followed by modernization of their applications, and Service Fabric provides first-class support for either scenario.

Lift, shift, and modernize

Many customers such as Alaska Airlines and ABBYY are using Windows Server containers to lift-and-shift their workloads to the cloud using Service Fabric. With lift-and-shift, minimal changes to the code are desired. Service Fabric provides a built-in DNS service to support communication between containers using DNS names requiring no code changes. This enables you to easily deploy multi-container applications and communicate between them.

Service Fabric natively supports Docker Compose manifests to describe container services in addition to its own application and service manifests. Lift-and-shift commonly entails moving existing services into containers from VMs. It is likely that all services, for example websites, are listening to the same port which can cause conflicts. Service Fabric supports those scenarios by offering multiple networking modes, including an “open” networking mode, where each container gets its own IP address so port conflicts are avoided.

Lift-and-shift exercises are undertaken not just for operational efficiency, but also cost savings. Service Fabric is an orchestrator built around dynamic resource balancing for efficient use of cluster resources. Thus, Service Fabric always balances the container services across the number of nodes available, and you can programmatically scale the cluster. The high density of containers that Service Fabric offers results in considerable cost savings upon migrating to the cloud.

A major consideration during lift-and-shift is enforcing security in the cloud. For securing your containers, Service Fabric supports Windows Hyper-V containers. Customers are recommended to use the Hyper-V isolation mode when they are running third-party code inside containers to obtain better isolation than the process isolation mode. To further support lift-and-shift, Service Fabric also supports gMSA (group Managed Service Accounts) for Windows containers. Additionally, Service Fabric has built-in certificate management to provide/limit access for containers to specific certificates. 

A good diagnostics experience is key for a seamless migration to the cloud. While any log driver can be used, Service Fabric also integrates with OMS Log Analytics for container logs on Windows and Linux.

Get started

While Service Fabric supports all the core orchestration functions such as rapid deployment of container services, resource governance, zero downtime upgrades, as well as volume and log drivers, it also includes several utility features such as the ability to prune container images to recover disk space and configure graceful shutdown for containers.

When you are modernizing your application by adding new cloud native services, you need additional tools in your kit. Service Fabric has you well covered for such scenarios. Service Fabric provides you with a broad range of features such as IDE support across platforms (Windows, Linux, and OSX) that help you develop and debug your containers to features optimized for container communication, such as the built-in naming service.

We’re continuously innovating

Now, about what’s coming in upcoming releases. We’re expanding the Service Fabric Explorer UI to show container logs and container specific views. For scenarios depending on stickiness of container addresses, Service Fabric will soon provide support for a stable IP per container, even when containers move from one VM to another. You can soon use the network isolation feature to create dedicated vNETs per application. To make Azure and Service Fabric a great choice for lift-and-shift, more features such as the support for container groups and built-in volume drivers for Azure Files are coming soon.

To help lift-and-shift even your state stores and scale them out as needed, as a data-aware container orchestrator, we’ll soon provide a built-in HA volume driver using the Service Fabric state store and pair it with intelligent routing. A simple programming model to access the state store within containers is also planned so that you can extract maximum performance. 

We love to hear from folks using Service Fabric. Let us know what’s working well and what’s not. Read our docs, learn from customers using Service Fabric, and try it out on a free Azure cluster. For more information, tune into our monthly community calls

Deployment strategies defined

$
0
0

This post is authored by Itay Shakury, Cloud Solution Architect.

In the world of devops practices and cloud native infrastructure, the concept of deployments has evolved from an uninteresting implementation detail, to a fundamental element for modern systems. It seems there's a general understanding of its importance, and work is being done to build solutions and tools for better deployment practices, but we never paused to agree and define on what are the deployment strategies that are important, and how to define them. It's not uncommon to see people use different terms for same meanings, or same terms for different meanings. This leads to other people reinventing the wheel trying to solve their own problems. We need a common understanding of this topic in order to build better tools, make better decisions, and simplify communication with each other.

This post is my attempt to list and define those common deployment strategies, which I called:

  • Reckless Deployment
  • Rolling Upgrade
  • Blue/Green Deployment
  • Canary Deployment
  • Versioned Deployment

There are probably other names and terms you expected to see on this list. I’d argue that those missing terms can be seen as variants of these primary strategies.

Note: The post is about definitions, methodologies and approaches and not about how to implement them in any technology stack. A technical tutorial will follow in another post. Stay tuned!

Read the full essay here.

Last week in Azure: Location-based services, Azure Migrate, and more

$
0
0

In addition to several stories and announcements last week related to data and analytics in Azure, we announced two significant public previews. First, at AutoMobility LA, we announced the public preview of Azure Location Based Services, which is a new Azure offering to power the “Location of Things.”  This includes geographical data that can better connect smart cities, infrastructure and IoT solutions, and empower industrial transformation, from manufacturing to retail to automotive – and everything in between. Second, now you can quickly and cost-effectively migrate your on-premises applications, workloads, and databases to the cloud with the Azure migration center, which launched in preview last week. It provides guidance, insights, and mechanisms to assist you in migrating to Azure.

Headlines

Announcing Azure Location Based Services public preview – Azure Location Based Services (LBS) adds native location capabilities to the Azure public cloud. LBS is a portfolio of geospatial service APIs natively integrated into Azure that enable you to create location aware apps and IoT, mobility, logistics and asset tracking solutions. The portfolio, provided in partnership with TomTom, includes Map Rendering, Routing, Search, Time Zones and Traffic.

Launching preview of Azure Migrate – Azure Migrate, which is now in preview, enables agentless agent-based discovery of VMware-virtualized Windows and Linux virtual machines. This enables dependency visualization, for a single VM or a group of VMs, to easily identify multi-tier applications. It also suggests workload-specific migration services, such as Azure Site Recovery.

Data + Analytics

Technical reference implementation for enterprise BI and reporting – Use this technical reference implementation to accelerate the deployment of a BI and reporting solution to augment your data science and analytics platform on Azure.

Server aliases for Azure Analysis Services - Server aliases for Azure Analysis Services enables you to connect to an alias server name instead of the server name exposed in the Azure portal, which makes it easier to migrate models, create friendly names, and have greater flexibility for managing traffic.

Run your PySpark Interactive Query and batch job in Visual Studio Code – Thanks to the integration of HDInsight PySpark into Visual Studio Code, you can now edit Python scripts and submit PySpark statements to HDInsight clusters and submit PySpark statements to HDInsight clusters in an interactive query-response experience.

Automatic tuning introduces Automatic plan correction and T-SQL management – Automatic tuning in Azure SQL Database now includes automatic plan correction, management via T-SQL, and a new column (auto_created) in the system view to identify indexes created by automatic tuning.

Elastic database tools for Java – An update to the Elastic Database Client Library for Azure SQL database supporting Java that provides tools to help you scale out the data tier of your applications using sharding, including support for multi-tenancy patterns for Software as a Service (SaaS) applications.

Azure Analysis Services integration with Azure Diagnostic Logs – New support for Azure Monitor Resource Diagnostic Logs enables you to run diagnostic logging on production Azure Analysis Services servers without a performance penalty.

ADL Tools for Visual Studio Code (VSCode) supports Python & R Programming – Support is now available in Visual Studio Code for Azure Data Lake (ADL) Python and R extensions to work with U-SQL for data extract, data processing, and data output.

Management

Introducing Azure Automation watcher tasks public preview – Using Azure Automation you can now integrate and automate processes across Azure and on-premises environments using a hybrid worker. Automatically response to events in your datacenter using watcher tasks, which give you the ability to poll systems in your environment with a watcher runbook and then process any events found by calling an action runbook.

Get notified when Azure service incidents impact your resources – The Azure Service Health preview enables you to create and manage alerts for service incidents, planned maintenance, and health advisories. You can also integrate your existing incident management system like ServiceNow®, PagerDuty, or OpsGenie with Service Health alerts via a webhook.

Service Updates

Azure is changing and growing daily. Azure Updates provides a feed of service updates that don’t always come with an announcement blog post.

Azure Shows

Azure Free Account – Amber Bhargava joins Scott Hanselman to discuss the new Azure free account. The new Azure free account provides Azure customers US $200 credit for first 30 days to experiment with a combination of services. Now it also includes 12-months of popular free services and 25+ always free services to learn and explore Azure further.

Durable Functions in Azure Functions – Chris Gillum joins Scott Hanselman to discuss a new extension of Azure Functions known as Durable Functions. Durable Functions is a programming model for authoring stateful, reliable, and serverless function orchestrations using C# and async/await.

The Azure Podcast: Episode 206 – Kubernetes – The guys talk about the rise of Kubernetes and discuss the architecture and how it can be run in Azure.

Cloud Tech 10 - 4th December 2017 - Location Based Services, Azure Migrate and more! – Each week, Mark Whitby, a Cloud Solution Architect at Microsoft UK, covers what's happening with Microsoft Azure in just 10 minutes, or less.

Breaking on DOM Mutations in the Microsoft Edge DevTools

$
0
0

Editor’s note: This continues the series we began last week, highlighting what’s new and improved in the Microsoft Edge DevTools with EdgeHTML 16.

As the web platform evolves, the line between web and application developers continues to blur. It’s common now for a web site to be more like a web app, with complex, single-page user interfaces built up by a combination of libraries and custom JavaScript code. This in turn has led to a web platform that requires more sophisticated tools to efficiently debug.

As we rely more and more on JavaScript to build up the DOM, and rely on tools that interact with and abstract away from us the nuances of DOMs across browsers, we lose the ability to easily know what caused a change to an interface node, especially if that change is unexpected. In EdgeHTML 16 (available with the Windows 10 Fall Creators Update), we’ve introduced the ability to break on mutations caused by any of the 450+ DOM APIs in the EdgeHTML platform and jump directly to the script that triggered the change.

For those who use Chrome DevTools, this will be a familiar and welcome addition to Edge debugging. It was our goal to implement and advance on a similar experience to make jumping between the two tools as seamless as possible. Read on for the changes you can expect in the Fall Creators Update (and can preview now via Windows Insider builds).

Breakpoint types

There are three breakpoint types:

  • Subtree modifications: when a node is added or removed from the subtree of the element on which the breakpoint is set
  • Node removal: when the node the breakpoint is set on is removed from the DOM tree
  • Attribute modifications: when an attribute of the node on which the breakpoint is set is modified

Setting and managing breakpoints

To set a breakpoint, right-click on a node in the DOM tree in the Elements tool. Under the DOM breakpoints item, you’ll see options to set and unset the supported breakpoint types.

Screen capture showing the context menu option to add DOM breakpoints in the Elements tool.

Add new breakpoints by right-clicking a node in the DOM tree and selecting “DOM breakpoints.”

When you add a breakpoint, a red breakpoint indicator appears next to the node in the DOM tree. The breakpoint is also listed in the DOM breakpoints pane which exists in both the Elements and Debugger tools. You can disable and delete breakpoints by using the mouse to click the checkbox and delete icons, respectively. You can also right-click, or use the keyboard, on a breakpoint to invoke a context menu to apply the same actions:

Screen capture showing the right-click options on breakpoints in the DOM Breakpoints pane.

Disable or delete breakpoints in the new DOM Breakpoints pane.

Triggering a breakpoint

A breakpoint is triggered whenever one of over 450+ DOM APIs are called by JavaScript. When the breakpoint triggers, you’ll jump to the Debugger tool with the file containing the triggering script opened and the line with the API call highlighted.

Screen capture showing a DOM breakpoint triggered on a page and the associated API call highlighted in the Debugger tool.

When a DOM API triggers a breakpoint, the Debugger tool will open with the API call highlighted.

In the Debugger tab, you’ll notice at the top of the call stack is an entry with the selector for the node the breakpoint was triggered on, and the type of breakpoint triggered.

Screen capture showing the Debugger tab open with the selector for the node the breakpoint was triggered on, and type of breakpoint triggered.

Breakpoint persistence

We store breakpoints as part of your Edge DevTools settings and scope them to the URL of the page they’re set within. When you close and re-open Edge DevTools, or refresh the page, we’ll restore and attempt to automatically rebind the breakpoints to their respective DOM nodes. If we’re unable to automatically rebind them, we’ll indicate that they’re unbound in the UI with a warning icon on the breakpoint circle.

Screen capture showing DOM Brekapoints pane with warning icons for unbound breakpoints.

Breakpoints that cannot be rebound when the session is restored will show an alert icon in the Breakpoints pane.

You can use the context menus or shortcut icons in the DOM breakpoints panes to manually rebind any breakpoints we were unable to automatically rebind.

What’s next for DOM Breakpoints

We’re excited to launch this feature and hope to solve for as many developer scenarios as we can, but want to highlight a few gaps in the current implementation:

  • We don’t currently support rebinding breakpoints inside iframes. If you set a breakpoint in an iframe and close Edge DevTools or refresh the page, the breakpoint will be lost.
  • If your script encounters a synchronously-executed breakpoint before the DOM readyState is completed, you won’t be able to set a DOM breakpoint while the debugger is paused. You can typically remedy this situation by setting the defer or async script attributes.
  • For synchronous scripts, we trigger automatic rebinding of breakpoints when the window.onload event is called. In this case, we may miss binding breakpoints that would trigger during initial script-driven build-up of the DOM. For asynchronous scripts, we trigger a rebind attempt before the first script executes, so your breakpoints may rebind and trigger as desired.

We’re evaluating closing these gaps in future releases, as we continue to evaluate the prevalence of these scenarios. If you have feedback and find these unsupported areas to be blockers, please let us know!

Tell us what you think

We hope you enjoy this new addition and find it improves your productivity as you go about your developer workflows. If you find any bugs, please report them via the Feedback Hub. If you have questions or feature requests, don’t hesitate to leave a comment here, or reach out to us on UserVoice or Twitter.

­Brendyn Alexander, Senior Program Manager, Microsoft Edge DevTools

The post Breaking on DOM Mutations in the Microsoft Edge DevTools appeared first on Microsoft Edge Dev Blog.

Extend your desktop application with Windows 10 features using the new Visual Studio Application Packaging Project

$
0
0

Visual Studio 2017 15.4 introduced the new Windows Application Packaging project to help you modernizing your application by using the new Windows 10 App Deployment Stack.

We talked about it in our previous post: Visual Studio 2017 Update 4 makes it easy to modernize your app and make it store ready and today we want to describe the new capabilities in Visual Studio 2017 15.5 that enable new scenarios to the Windows application packaging project to take advantage of more Windows 10 features in your applications.

During this article we will cover three examples to highlight the new capabilities added to the packaging project to enable packaging for not only Win32 applications, but also UWP applications and components:

  1. Background execution using UWP background tasks.
  2. Windows Shell integration using the Share Target contract.
  3. Include Win32 code investments in your UWP app package.

The first two samples are existing WPF applications packaged as APPX with extended functionality implemented as UWP components. The first application adds background execution based on UWP background tasks, while the second app shows how to deeply integrate the application with the Windows 10 shell using a widely available feature as Share contracts. Finally, the last app is a UWP entry point that calls to a classic Win32 process that interop with Excel.

Note: Because the UWP components require to be compiled for a specific platform: x86 or x64, the Any CPU solution configuration will not work in any of these samples.

All samples are available in the GitHub repo Windows-Packaging-Samples. These samples require Visual Studio 2017 15.5 Preview 4 or greater, available to download from https://www.visualstudio.com/downloads.

1. WPF with Background Tasks

The Universal Windows Platform includes support for advanced background processing. Background tasks allow running code even when the app is suspended. Background tasks are intended for small work items that do not require user interaction, such as downloading mail, showing a toast notification for an incoming chat message or reacting to a change in a system condition.

To show how to use this feature from your Win32 applications, we are going to implement a small utility that will make an HTTP request to a URL configured by the user and will show the elapsed milliseconds in a Toast Notification.

We will create a WPF application to allow the user to specify the URL to check and enable/disable the background task. The background task will be implemented as a Windows Runtime Component (WINMD). To be able to include this component in the package, we need to create a UWP application that uses the component, and finally add the WPF and UWP projects as references to the packaging project. Below is the list of steps needed.

You can find the complete source code of this sample in the GitHub repository, but if you want to create the sample from scratch here are the most important steps.

  1. Package your desktop application using the packaging project
  2. Add a Windows Runtime component to implement the background task
  3. Add a UWP application that reference the runtime component
  4. Add a reference to the UWP application from the packaging project
  5. Configure the Background task in the manifest
  6. Register the background task from the Desktop application

Once you completed steps 1 to 4, you should have a solution for projects as shown in the image below:

The packaging project references not only the WPF application, but also the UWP project. For this reason, the solution needs to be configured for a specific platform, since UWP is not available for Any CPU configurations.

Background Task implementation

The background task is a C# class that implements the IBackgroundTask interface. This interface defines the Run method that will be called when the system triggers the task.


public sealed class SiteVerifier : IBackgroundTask
{
    public async void Run(IBackgroundTaskInstance taskInstance)
    {

        taskInstance.Canceled += TaskInstance_Canceled;
        BackgroundTaskDeferral deferral = taskInstance.GetDeferral();
        var msg = await MeasureRequestTime();
        ShowToast(msg);
        deferral.Complete();
    }

    private async Task<string> MeasureRequestTime()
    {
        string msg;
        try
        {
            var url = ApplicationData.Current.LocalSettings.Values["UrlToVerify"] as string;
            var http = new HttpClient();
            Stopwatch clock = Stopwatch.StartNew();
            var response = await http.GetAsync(new Uri(url));
            response.EnsureSuccessStatusCode();
            var elapsed = clock.ElapsedMilliseconds;
            clock.Stop();
            msg = $"{url} took {elapsed.ToString()} ms";
        }
        catch (Exception ex)
        {
            msg = ex.Message;
        }
        return msg;
}

Note how we use the LocalSettings in ApplicationData to share information between the WPF application and the UWP background task.

To configure the background task, you need to update the manifest using the manifest designer. Go to the declarations tab, add the background task and configure the entry point as the implementation.

To register the background task in the system, we need to call a Windows 10 API from the WPF application. This API is available in the Windows 10 SDK, and to use it from .NET we need to add the references explained here. Once you have access to the Windows 10 API you can use  the BackgroundTaskRegistration class to configure the background task as shown in the code below:


public void RegisterBackgroundTask(String triggerName)
{
    var current = BackgroundTaskRegistration.AllTasks
        .Where(b => b.Value.Name == triggerName).FirstOrDefault().Value;

    if (current is null)
    {
        BackgroundTaskBuilder builder = new BackgroundTaskBuilder();
        builder.Name = triggerName;
        builder.SetTrigger(new MaintenanceTrigger(15, false));
        builder.TaskEntryPoint = "HttpPing.SiteVerifier";
        builder.Register();
        System.Diagnostics.Debug.WriteLine("BGTask registered:" + triggerName);
    }
    else
    {
        System.Diagnostics.Debug.WriteLine("Task already:" + triggerName);
    }
}

To register the background task, first we make sure the task has not been registered before, and then we use the BackgroundTaskBuilder to configure the name and the Trigger, in this case we are using the MainteinanceTrigger.

2. Register your application as Share Target

Share contracts is a Windows 10 feature that allows the sharing of information between two apps, the sender and the receiver. Thanks to the Desktop Bridge, we can register a UWP application as a Share receiver and then integrate with a Win32 application. Once the app is registered, it will be shown every time the user invokes a share operation as shown below:

In this sample, we are extending a WPF application to become a share target where users can send images from other apps like the Photos app, Edge or even the Shell to our application. We are using the packaging project to include not only the WPF application, but also a UWP application that allows a UWP UI to receive events from the share target. Below you can see the solution explorer with the packaging project referencing the WPF and UWP projects.

The package needs to declare the Share Target, including the name of the UWP application:

When the application gets activated, it receives the share target information from the ShareOperation parameter as shown in the code snippet below:


protected async override void OnNavigatedTo(NavigationEventArgs e)
{
    base.OnNavigatedTo(e);
    operation = (ShareOperation)e.Parameter;
    if (operation.Data.Contains(StandardDataFormats.StorageItems))
    {
        var items = await operation.Data.GetStorageItemsAsync();
        file = items[0] as StorageFile;
        IRandomAccessStreamWithContentType stream = await file.OpenReadAsync();

        await this.Dispatcher.RunAsync(CoreDispatcherPriority.Normal, async () =>
        {
            BitmapImage image = new BitmapImage();
            this.img.Source = image;
            await image.SetSourceAsync(stream);
        });
    }
}

Now every time the user shares a picture and selects our application, the Share UI application gets invoked and the UWP UI will be displayed.

After clicking the “Share to WPF app” button, the UWP will process the event handler, and will copy the picture to the ApplicationData folder and run the Win32 application using the FullTrustProcessLauncher.


private async void ShareBtn_Click(object sender, RoutedEventArgs e)
{
    await file.CopyAsync(ApplicationData.Current.LocalFolder);
    operation.ReportCompleted();
    await FullTrustProcessLauncher.LaunchFullTrustProcessForCurrentAppAsync();
}

To use the FullTrustProcessLauncher we will use the Desktop extension to UWP, this extension is available as an SDK reference available in the Add References dialog of the UWP application:

And finally, register the desktop extension and the target executable in the manifest:


<Package xmlns="http://schemas.microsoft.com/appx/manifest/foundation/windows10"
         xmlns:mp="http://schemas.microsoft.com/appx/2014/phone/manifest"
         xmlns:uap="http://schemas.microsoft.com/appx/manifest/uap/windows10"
         xmlns:rescap="http://schemas.microsoft.com/appx/manifest/foundation/windows10/restrictedcapabilities"
         xmlns:desktop="http://schemas.microsoft.com/appx/manifest/desktop/windows10"
         IgnorableNamespaces="uap mp rescap desktop">
<... >
<desktop:Extension Category="windows.fullTrustProcess"
                   Executable="WPFPhotoViewerWPFPhotoViewer.exe" />
<... >

3. Enable Office interop from UWP application

One of the key features of the Desktop Bridge is the ability to include Win32 executables on your application package and run those as full trust process from a UWP application. Now, with the Windows Application Packaging project, you can create packages that contain both UWP and Win32 binaries.

Additionally, to the process launcher, the App Service extension will help you to establish a communication channel between your UWP application and the Win32 process.

In this sample we are going to include a Win32 process (a command line application) to manage an Excel worksheet using office interop.

We start with a UWP application that uses the Telerik data grid to show some tabular data, and we will add button to export the same data to Excel as shown in the image below:

The solution explorer of this example looks very similar to our previous example, with three projects in the solution: The UWP application, the Win32 command line and the packaging project with a reference to both projects. However, note that in this case the Application entry point (shown in bold) is the UWP project:

As we did in our previous example, we need to add a reference to the Desktop extension and register the full trust process in the manifest. But this time, we will also register the application service in the package manifest:

To open the communication channel in the Win32 process, we will add a reference to the Windows API as described here:

To establish the connection, we will use the AppServiceConnection class, where we need to specify the package family name of the application we want to connect with, and the event handlers we will use to process the incoming requests.


Connection = new AppServiceConnection();
connection.AppServiceName = "ExcelInteropService";
connection.PackageFamilyName = Windows.ApplicationModel.Package.Current.Id.FamilyName;
connection.RequestReceived += Connection_RequestReceived;
connection.ServiceClosed += Connection_ServiceClosed;

Conclusion

The new features added to the packaging project in Visual Studio 2017 will help you to modernize your existing desktop applications to get the best from UWP and Win32 in the same package. This new project will help you to configure your package by using the manifest designer, debug your application in the context of the Desktop Bridge and finally, help to create the packages for store submission or sideloading. Here are some resources for more details:

Are you ready to submit your desktop application to the Microsoft Store? Let us know about it here, and we will help you through the process!

The post Extend your desktop application with Windows 10 features using the new Visual Studio Application Packaging Project appeared first on Building Apps for Windows.

Visual Studio 2017 Version 15.5, Visual Studio for Mac Released

$
0
0

[Hello, we are looking to improve your experience on the Visual Studio Blog. It will be very helpful if you could share your feedback via this short survey that should take less than 2 minutes to fill out. Thanks!]


Today we released significant updates to both Visual Studio 2017 and Visual Studio for Mac. I’ll share some details in this post, but as always, there’s a lot more information in the release notes. If you’d like to jump right in, download Visual Studio 2017 version 15.5 and download Visual Studio for Mac.

Visual Studio 2017 Version 15.5

This update contains major performance improvements, new features, as well as fixes for bugs reported by you. Some highlights are mentioned below, for the full feature list check out the Visual Studio 2017 version 15.5 Release notes.

Performance. In this update we continued to improve performance. Solution load times for large C# and Visual Basic projects is nearly cut by half. The time to switch between debug and release is significantly reduced. It is faster to add, remove, and rename files and folders in .NET Core projects. Project templates should now unfold much faster than before. In the most exceptional cases, you can see up to a 40x improvement in unfold time. There are multiple performance improvements in F# tooling. We’ve added an “Only analyze projects which contain files opened in the editor” checkbox under the JavaScript/TypeScript Text Editor Project Options page. This option will improve performance and reliability in large solutions. Note that when this box is checked, you will need to perform a Solution build to see a complete list of TypeScript errors in all files.

Most notably, we have cut the solution load times for large C# and VB projects by half. The primary way we achieved this was by starting the design-time build process earlier and by batching the design-time build operations for all projects and executing them in parallel with other solution load operations. To see this in action, watch this video comparison loading the Orchard Content Management System solution before and after optimization.

Solution Load Video Comparing 15.4 and 15.5

Check out our detailed post to learn how we achieved this performance in large C# and VB projects. For those who missed the similar performance improvement we made for C++ projects in an earlier update check out this blog post on C++ solution load and build performance improvements.

Diagnostics. The Visual Studio debugger got considerably more powerful with the addition of step-back debugging, also known as historical debugging. Step-back debugging automatically takes a snapshot of your application on each breakpoint and debugger step you take, enabling you to go back to a previous breakpoint to view its state. Check out this post from Deborah that details out this capability and how to make the most of it – step-back while debugging with IntelliTrace. For more on diagnostics and debugging, also look at our post on lesser known debugging features.

Docker and Continuous Deployment. Visual Studio has featured good Docker support for a while. With this release we have taken it further. Docker containers now support multi-stage Dockerfiles. The continuous delivery features make it easy to configure Visual Studio Team Services to set up CD for ASP.NET and ASP.NET Core projects to Azure App Service

Secrets management. Visual Studio has added features to help identify and manage secrets like database connection strings and web service keys. We have a preview of support for credential scanning that can easily read through your source files to ensure you don’t unintentionally publish key secrets into your source repo. And the integrated support for Azure KeyVault gives you an easy place to publish those secrets (and get them out of your source code). Check out this post to learn how to manage secrets securely in the cloud.

Azure functions. The Visual Studio tools for Azure functions has gotten a notable improvement, with the ability to use .NET Core. Learn about added support for creating .NET Core Azure Functions apps, as well as improving the experience for creating new Function app projects.

Mobile development with Xamarin. A major milestone in this release for mobile development was the addition of the Xamarin Live Player, which enables developers to continuously deploy, test, and debug their apps using just Visual Studio and an iOS or Android device. This release adds support for Android emulators, enabling developers to preview real-time XAML changes directly in the Android emulator without requiring a re-compile and re-deploy.

Mobile development with Xamarin Live Player

We have also added the ability to File → New → Mobile App with Xamarin.Forms and .NET Standard, and migrated all project templates to use PackageReference for easy NuGet package management.

Unit Testing. We’ve improved the unit testing experience for both managed languages and for C++. C++ developers will notice integrated support for Google Test and Boost.test (add them through the Visual Studio installer in the desktop development workload). We already mentioned feature behind a feature flag called source-based test discovery that hugely improves test discovery performance. And the Live Unit Testing (LUT) is better integrated with the task notification center and now supports .NET Core (starting in Visual Studio 2017 15.3) as well as MSTest v1. Be sure to check out this post for an overview of the various text experience improvements in Visual Studio 2017 version 15.5.

Task Center Notification so you know if Live Unit Testing is discovering building or executing your test

Web development. If you are an Angular 2 developer you will now see errors, completions, and code navigation in inline templates and .ngml template files. See the sample repo for an overview and instructions. Other updates in the web space include improvements to Razor syntax formatting and improvements in the workflow for publishing ASP.NET applications to Azure Virtual Machines.

Visual C#. VS 15.5 adds support for C# 7.2 features like Span<T>, the readonly struct modifier And the private protected access modifier.

Visual C++. We already talked about the support for Google Test and Boost.test, and C++ developers will also see improvements to the Standard Template Library for C++ 17 standards. Check out the Open Standards website. The VC++ compiler supports 75% of the C++ 17 features. In addition, the team has added new optimizations to the compiler.

Installer showing VC Testing Improvements workload with default support for Google Test and Boost.Test

Visual F#. We added .NET Core SDK project support to the F# tooling so you can now create new .NET Core console apps, .NET Standard libraries, and .NET Core unit test projects from File > New Project, for example, and we added support for project-to-project references. You can also you can now right-click Publish tooling with Web SDK projects and the continuous delivery features will now autogenerate a CI/CD pipeline with Visual Studio Team Services tooling.

Source control. You can now work with Git submodules and worktrees, and configure fetch.prune and pull.rebase in Team Explorer. Visual Studio now treats Git submodules and worktrees like normal repos. Just add them to your list of Local Repositories and get coding!

Reliability. The Visual Studio Installer now supports modification and uninstallation of each entry, improving the installer experience. On the note of the crashes caused by the PenIMC.dll that some of you may have run into, Windows is currently working on a root fix. Meanwhile, we wanted to ensure we helped those of you still running into crashes when trying to scroll, click, or interact via touch in Visual Studio. To activate the workaround, disable touch scrolling by checking the “Disable Touch Scrolling” under Tools > Options > Environment > General and restart Visual Studio.

Visual Studio for Mac

VS for Mac 7.3 is also available today. The highlights of this release are:

Visual Studio Test Platform (VSTest) support. Visual Studio for Mac now supports a wider variety of test frameworks through the integration of VSTest, giving developers more choice in the test frameworks they want to use. Frameworks such as MSTest or xUnit can now be used within Visual Studio for Mac via NuGet adapter packages.

New Roslyn based refactorings. The editor in Visual Studio for Mac has improved support for refactoring, helping developers write more maintainable code. “Generate From Usage”, “Change Method Signature”, and “Extract Interface” are now offered as refactorings within C# code.

Updater support for .NET Core. Visual Studio for Mac will now check to see if the .NET Core 2.0 SDK is installed when checking for updates. If not, developers can easily download and install it via the Visual Studio Update dialog instead of the previous manual installation.

Automatic iOS app signing. Visual Studio for Mac now offers automatic signing of iOS apps, boosting developer productivity by reducing the number of manual steps required to prepare iOS apps for distribution.

Additionally, a lot of the improvements in this update center on reliability. Improvements were made to decrease memory usage, increase performance, and decrease crashes. Many of these fixes have been made possibly by community feedback, which has been provided through the Developer Community.

The complete release notes are available on visualstudio.com, which is also where you can find the Visual Studio for Mac downloads.

Share Your Feedback

As always, we welcome your thoughts and concerns. Please install Visual Studio 2017 Version 15.5, and Visual Studio for Mac and tell us what you think.

For issues, let us know via the Report a Problem tool in Visual Studio. You’ll be able to track your issues in the Visual Studio Developer Community where you can ask questions and find answers. You can also engage with us and other Visual Studio developers through our new Gitter community (requires GitHub account), make a product suggestion through UserVoice, or get free installation help through our Live Chat support. Need professional support right now? See available support options.

John Montgomery, Director of Program Management for Visual Studio
@JohnMont

John is responsible for product design and customer success for all of Visual Studio, C++, C#, VB, JavaScript, and .NET. John has been at Microsoft for 17 years, working in developer technologies the whole time.


AI School: Microsoft R and SQL Server ML Services

$
0
0

If you'd like to learn how you use R to develop AI applications, the Microsoft AI School now features a learning path focused on Microsoft R and SQL Server ML Services. This learning path includes eight modules, each comprising detailed tutorials and examples:

All of the Microsoft AI School learning paths are free to access, and the content is hosted on Github (where feedback is welcome!). You can access this course and many others at the link below.

Microsoft AI School: Microsoft R and SQL Server ML Services 

Azure IoT Hub Device Provisioning Service is generally available

$
0
0

The Azure IoT Hub Device Provisioning Service is now available with the same great support you've come to know and expect from Azure IoT services. The Device Provisioning Service enables customers to configure zero-touch device provisioning to Azure IoT Hub, and it brings the scalability of the cloud to what was once a laborious one-at-a-time process. The Device Provisioning Process was designed with the challenges of the supply chain in mind, providing the infrastructure needed to provision millions of devices in a secure and scalable manner.

image

With general availability support comes expanded protocol support. Automatic device provisioning with the Device Provisioning Service now supports all protocols that IoT Hub supports including HTTP, AMQP, MQTT, AMQP over websockets, and MQTT over websockets. This release also corresponds to expanded SDK language support for both the device and client side. We now support SDKs in the following languages including C, C#, Java, Node (service for now, device coming soon), and Python (device for now, service coming soon). Get started with the Device Provisioning Service with the quick start tutorials.

The Device Provisioning Service works in a wide variety of scenarios:

  • Zero-touch provisioning to a single IoT solution without requiring hardcoded IoT Hub connection information in the factory (initial setup).
  • Automatically configuring devices based on solution-specific needs.
  • Load balancing devices across multiple hubs.
  • Connecting devices to their owner’s IoT solution based on sales transaction data (multitenancy).
  • Connecting devices to a specific IoT solution depending on use-case (solution isolation).
  • Connecting a device to the IoT hub with the nearest geo-location.
  • Re-provisioning based on a change in the device, such as a change in ownership or location.

The Device Provisioning Service is flexible enough to support all those scenarios using the same basic flow:

image

We've made it easier than ever to use hardware-based security with the Device Provisioning Service device SDKs. We offer in-box support for different kinds of hardware security modules (HSMs), and we have partnerships with several hardware manufacturers to help our customers be as secure as possible. You can learn more about the hardware partnerships by reading the blog post Provisioning for true zero-touch secure identity management for IoT, and you can learn more about HSMs by reading the blog post Azure IoT supports new security hardware to strengthen IoT security. The SDKs are extensible to support other HSMs, and you can learn more about how to use your own custom HSM with the device SDKs. While using an HSM is not required to use the Device Provisioning Service, we strongly recommend using one in your devices. The SDKs provide a TPM simulator and a DICE simulator (for X.509 certs) for development and testing purposes. Learn more about all the technical concepts involved in device provisioning.

Azure IoT is committed to offering you services which take the pain out of deploying and managing an IoT solution in a secure, reliable way. To learn more please watch the videos What is the Device Provisioning Service and Provisioning a real device. You can create your own Device Provisioning Service on the Azure portal, and you can check out the device SDKs on GitHub. Learn all about the Device Provisioning Service and how to use it in the documentation center. We would love to get your feedback on secure device registration, so please continue to submit your suggestions through the Azure IoT User Voice forum.

To sum things up with a limerick:

Come join us in our celebration
Of IoT auto-registration
It’s generally available
Full-featured and capable
For your devices’ automation

Announcing the Lv2-Series VMs powered by the AMD EPYC™ processor

$
0
0

Providing a diverse set of Virtual Machine sizes and the latest hardware is crucial to making sure that our customers get industry-leading performance for every one of their workloads. Today, I am excited to announced we are introducing the next generation of storage-optimized L-series VMs powered by AMD EPYCTM processors.

We’re thrilled to have AMD available as part of the Azure Compute family. We’ve worked closely with AMD to develop the next generation of storage optimized VMs called Lv2-Series, powered by AMD’s EPYC™ processors. The Lv2-Series is designed to support customers with demanding workloads like MongoDB, Cassandra, and Cloudera that are storage intensive and demand high levels of I/O.

Lv2-Series VM’s use the AMD EPYC™7551 processor, featuring a core frequency of 2.2Ghz and a maximum single-core turbo frequency of 3.0GHz. Lv2-Series VMs will come in sizes ranging up to 64 vCPU’s and 15TB of local resource disk. 

If you’re interested in being one of the first to try out these new sizes as part of the preview for Lv2 VMs.

Size vCPU’s Memory (GiB) Local SSD (GiB)
L8s 8 64 1 x 1.9TB
L16s 16 128 2 x 1.9TB
L32s 32 256 4 x 1.9TB
L64s 64 512 8 x 1.9TB

See ya around,

Corey

Microsoft IoT Central delivers low-code way to build IoT solutions fast

$
0
0

Following a successful limited preview, today we are announcing the public preview of Microsoft IoT Central. Microsoft IoT Central is the first true highly scalable IoT SaaS solution that has built-in support for IoT best practices and world class security along with the reliability, regional availability, and the global scale of the Azure cloud.

Microsoft IoT Central overview

Microsoft IoT Central allows companies throughout the world to build production-grade IoT applications in hours and not worry about managing all the necessary backend infrastructure or hiring new skill sets to develop the solutions. In short, Microsoft IoT Central makes it so that everyone can benefit from IoT.

Simplifying IoT means reducing the complexities related to customizing, deploying and scaling an IoT solution, and to ensure that these benefits can be leveraged by our enterprise customers, Microsoft IoT Central provides a comprehensible, yet growing, set of enterprise-grade features and leverages proven technologies and acclaimed Azure services.

Connectivity and security

To unleash the full potential of connected devices, Microsoft IoT Central leverages Azure IoT Hub as its cloud gateway, for securely connecting, provisioning, updating, and sending commands to devices. Microsoft IoT Central customers will be able to leverage features such as:

  • Device authentication and secure connectivity: Each device uses its own security key to connect to the cloud in a secure way.
  • Extensive set of device libraries: Azure IoT device SDKs are available and supported for a variety of languages and platforms such as Node.js, C/C#, and Java.
  • IoT protocols and extensibility: Native support of the MQTT 3.1.1, HTTP 1.1, and AMQP 1.0 protocols for device connectivity.
  • Scalability: Microsoft IoT Central automatically scales to support millions of connected devices and by millions of events per second ingested through its cloud gateway, and stored though its time-series storage.

Devices and device templates

Microsoft IoT Central provides the ability to create and persist a digital representation of your connected devices. Devices in Microsoft IoT Central are live and actionable logical representations of your connected assets with their own defining attributes. The creation of a device happens directly on the cloud, inside the Microsoft IoT Central Application Builder, a low-code environment where users can define device attributes and visualizations via drag and drop from libraries of assets. Even before connecting a real device, users can experiment and test their application by simulating a device through the simulation service embedded in Microsoft IoT Central. Devices are templatized to make it faster and easier to provision device identities at scale and templates are versioned to support DevOps.

Device measurements

To monitor and manage the devices effectively, users can define the different types of measurements emitted by it and displayed by the application. Microsoft IoT Central supports measurements types such as telemetry including device-emitted numeric values, often collected at a regular frequency (e.g. temperature), events including device-emitted numeric or non-numeric values generated on the device, with no inferable relationship over time (e.g. button press and error code), and state including device-emitted numeric or non-numeric values which defines the state of a device or one of its parts and maintained until the state change is informed by the device (e.g. Engine ON). 

Device properties & settings

To track the non-frequently changing business data such as customer name, address, and last maintenance date, associated with devices, Microsoft IoT Central enables the use of metadata, persisted on the cloud and updated either by the device itself (device properties) or the user (cloud properties) to better identify and manage devices. Metadata persisted on the cloud can also be used to remotely control devices with Settings: when a setting is changed on Microsoft IoT Central, the desired change is sent to the device, which then takes the appropriate action and responds back with the progress and, eventually, reports that the change has successfully been applied.

Rules engine

A critical component of an IoT solution is the ability for users to be made aware when device conditions meet important criteria, whether it is pertaining to device health or just KPIs, and trigger appropriate actions.

To support this need, Microsoft IoT Central enables users to create rules – a set of conditions based on device measurements, properties and settings – by providing rule templates as a starting point.

Conditions are verified against streaming and persisted data through a real-time analytics service, automatically managed and scaled by Microsoft IoT Central, and trigger actions when verified. Actions include notifications and a wide range of extensions that are coming soon, such as Webhooks, Logic Apps, Azure Functions, 3rd party application integrations, etc.

Device management

To support customers in managing a large number of devices, and grouping them into smaller logical sets to help visualize and analyze their data, Microsoft IoT Central enables users to create Device Sets based on dynamic conditions such as device properties. Device Sets can be used to create meaningful Dashboards or as a starting point for time-series analytics.

Analytics and dashboards

Microsoft IoT Central integrates Azure Time Series Insights – a fully managed analytics, storage, and visualization service for managing IoT-scale time-series – to enable users to explore and analyze billions of events streaming simultaneously from devices deployed all over the world. Microsoft IoT Central provides massively scalable time-series data storage and several ways to explore data, making it super easy to explore and visualize millions of data points simultaneously, conduct root-cause analysis, and to compare multiple sites and assets. Within an application, time-series visualization is available for a single device, for a Device Set – with the ability to compare multiple devices - and as a multi-purpose Analytics tool.

Devices and Devices Sets have dashboards with a comprehensible set of tiles, which can be configured to represent all their characteristics – measurements, properties, etc. – in a simple, meaningful and compelling way. Dashboards tiles can be moved or arranged however you want to present your information: their dimensions can be changed by height or width, and they can be arranged next to other tiles to represent your data however you want.

Authentication and authorization

To ensure the maximum level of security and the flexibility to customize access privileges, Microsoft IoT Central supports authentication of enterprise users via Azure Active Directory and single users with a Microsoft account. To be authorized to access an application, users must be assigned a role, which defines the level of access and the privileges that each user has in the context of each application. Microsoft IoT Central also supports advanced security and user management features such as Two-factor authentication and Security Groups.

Application templates and free trial

To explore all its features and capabilities, and appreciate the full potential of applications created, Microsoft IoT Central provides a 30 day free trial. You can connect, or simulate, up to 10 devices and leverage all the functionalities of the solution. You can start with a blank application to create your own custom solution, or start from one of the available templates, like the fully featured Contoso demo app. You can also start by connecting a developer board, such as a MXChip Azure IoT Developer Kit or a Raspberry Pi. 

You can find more information on the Microsoft IoT Central website or start your free trial.

Resumable Online Index Rebuild is generally available for Azure SQL DB

$
0
0

We are delighted to announce the general availability of Resumable Online Index Rebuild (ROIR) for Azure SQL DB. With this feature, you can resume a paused index rebuild operation from where the rebuild operation was paused rather than having to restart the operation at the beginning. Additionally, this feature rebuilds indexes using only a small amount of log space. You can use the new feature in the following scenarios:

  • Resume an index rebuild operation after an index rebuild failure (such as after a database failover or after running out of disk space). There is no need to restart the operation from the beginning. This can save a significant amount of time when rebuilding indexes for large tables.
  • Pause an ongoing index rebuild operation and resume it later. For example, you may need to temporarily free up system resources in order to execute a high priority task or you may have a single maintenance window that is too short to complete the operation for a large index. Instead of aborting the index rebuild process, you can pause the index rebuild operation and resume it later without losing prior progress.
  • Rebuild large indexes without using a lot of log space and have a long-running transaction that blocks other maintenance activities. This helps log truncation and avoid out of log errors that are possible for long running index rebuild operations.


For more information about ROIR please review the following documents

For futher communication on this topic please contact the ResumableIDXPreview@microsoft.com alias.

Database Scoped Global Temporary Tables are generally available for Azure SQL DB

$
0
0

We are delighted to announce the general availability of Database Scoped Global Temporary Tables for Azure SQL DB.  Similar to global temporary tables for SQL Server (tables prefixed with ##table_name), global temporary tables for Azure SQL DB are stored in tempdb and follow the same semantics. However, rather than being shared across all databases on the server, they are scoped to a specific database and are shared among all users’ sessions within that same database. User sessions from other Azure SQL databases cannot access global temporary tables created as part of running sessions connected to a given database.  Any user can create global temporary objects.

Example

  • Session A creates a global temp table ##test in Azure SQL Database testdb1 and adds 1 row
     T-SQL command
    CREATE TABLE ##test ( a int, b int);
    INSERT INTO ##test values (1,1);
  • Session B connects to Azure SQL Database testdb1 and can access table ##test created by session A
     T-SQL command
    SELECT * FROM ##test
    ---Results
    1,1

For more information on Database Scoped Global Temporary Tables for Azure SQL DB see CREATE TABLE (Transact-SQL).

HDInsight Tools for VSCode supports Azure environments worldwide

$
0
0

To better serve HDInsight customers worldwide, HDInsight Tools for VSCode now can be connected to all the Azure environments which host HDInsight services. This includes Azure government and regional clouds used by customers with specific compliance and data sovereignty requirements. Developers can easily switch across different Azure environments through the Set Azure Environment command in the VSCode command palette. This feature is especially useful for Hive and Spark developers who would like to have an editor with easy data query or job submission for Azure government and regional environments but found it difficult. With this new capability we help those customers by providing fast and simple access to HDInsight Tools for VSCode and connecting to Azure environments in just a click.

Azure Command

Azure Environment

As documented in our previous communications, HDInsight Tools for VSCode supports Hive Interactive Query, Hive Batch, PySpark Interactive and PySpark Batch. It is light-weight, cross-platform and greatly improves the development experience on HDInsight. Please refer to blogs below for our recent announcements:

How to install or update

First, install Visual Studio Code and download Mono 4.2.x (for Linux and Mac). Then get the latest HDInsight Tools by going to the VSCode Extension repository or the VSCode Marketplace and searching “HDInsight Tools for VSCode”.

a4991f2e-c132-4794-8a4c-08b3cf68b328

For more information about HDInsight Tools for VSCode, please use the following resources:

Learn more about today’s announcements on the Azure blog and Big Data blog. Discover more on the Azure service updates page.

If you have questions, feedback, comments, or bug reports, please use the comments below or send a note to hdivstool@microsoft.com.


Don’t build your cloud home on shaky foundations

$
0
0

You probably wouldn’t furnish a house you’re building with a state of the art entertainment system without first installing doors and an alarm system. Similarly, it isn’t advisable to put valuable applications and data used to run your business in the cloud without ensuring the proper foundational security and governance controls are in place.

Great buildings aren’t built on weak foundations

Many organizations struggle with how they want their cloud home to look, often so anxious to move that proper planning is ignored. Whether adopting PaaS, IaaS, or SaaS, properly planned governance and security foundations are key to ensuring a protected and controlled environment.

Building governance and security foundations in Azure

Before loading mission critical workloads or data, ensure your foundational governance model considers your organization’s operational, security, and compliance requirements without slowing down your adoption. Scale your business cloud footprint with peace of mind while leveraging the agility offered by cloud resources.

There are 6 top design considerations you should consider when laying the foundational components for a structured governance model in Azure:

1. Accounts/enterprise agreement: The cornerstone of governance allowing for subdivisions into departments, accounts, and subscriptions.

  • Best practice: Use an O365 mailbox or on-premise monitored mailbox whose account is synchronized to O365 to automate assignment and revocation as part of your Identity and Access management policies.

2. Subscriptions: This is the administrative security boundary of Azure, containing all resources and defining several limits including number of cores and resources.

  • Best practice: Design the organizational hierarchy, keeping in mind that one or multiple subscriptions can only be associated with one Azure AD at a time. Plan based on how your company operates, understanding the impact on billing, resource access, and complexity specific to your needs.
  • Tip: Keep the subscription model simple but flexible enough that it can scale as required.

3. Naming standards: Cohesiveness is key for locating, managing, and securing resources while minimizing complexity. Leverage existing standards to use a similar naming scheme for resources.

  • Best practice: Review and adopt the patterns and practices guidance to help decide on a meaningful naming standard, and consider using Azure Resource Manager policies to enforce them.

4. Resource policies and resource locks: Mitigate cost overruns, data residency, or accidental outages that can bring your organization down. Create a policy preventing compute resources to be created outside of Azure Canadian regions to ensure adherence to compliance policies mandated for certain types of data. Ensure specific types of VMs can be created to ensure budget adherence for dev test resource groups. For labeling, create a policy that enforces tagging to ensure production environment resources are tagged from dev/test resources at the time of creation.

  • Tip: Leverage the use of resource locks to ensure certain key resources can’t be easily deleted.

5. Implement a least privileged access model: Permissions are inherited from the subscriptions to the resource groups and the resources within them including storage, network, and VMs.

  • Best practice: Delegate access based on need and tasks. For example, cloud operators can be added to the Virtual Machine Contributor role for the resource groups they manage as opposed to subscription level. For additional security, also enforce Multi-Factor Authentication for access to resources by privileged accounts.

6. Implement Azure Security Center and Azure Advisor: Understand your current security posture by enabling Azure Advisor and Azure Security Center which will allow you to:

  • Apply policy to ensure compliance with security standards.
  • Find/fix vulnerabilities before they can be exploited across VMs, networks, and storage.
  • Optimize your Azure resources for high availability, security, performance, and cost.
  • Implement personalized recommendations with ease.

To learn more about Azure Governance, reference the Azure enterprise scaffold. Contact Microsoft Services to find out how we can help you implement a scalable and future-proof Azure governance framework.

Azure Goverance Foundations

Bringing hybrid cloud Java and Spring apps to Azure and Azure Stack

$
0
0

Microsoft is proud to be a platinum sponsor of Pivotal’s SpringOne Platform conference, which started yesterday in San Francisco. SpringOne Platform is a premier destination for enterprise developers and architects who are passionate about cloud-native applications, and IT leaders that have seen first-hand how cloud-native and serverless programming are transforming organizations in the cloud.

At Microsoft, we believe that our role doesn’t stop at offering a great platform for cloud-native apps. It’s equally important that developers can deliver high quality software rapidly to their teams, and that’s why we’ve been rethinking what the developer experience for cloud-native applications looks like. We’re working with partners and the ecosystem to offer the most productive tools for developers to build agile applications across multiple environments.

With that goal in mind, today at SpringOne Platform we’re proud to join Pivotal in announcing improved support for Pivotal Cloud Foundry across Azure and Azure Stack. This is an important milestone in our partnership with Pivotal and in making our hybrid cloud, both public and private, a leading platform to run enterprise Java and Spring applications. Additionally, we are taking the opportunity to unveil three new products and updates to improve support for Java and Spring on Azure — enhancements to Java Azure Functions, including remote debugging support, and new Spring and Java Azure Functions extensions for Visual Studio Code.

Pivotal Cloud Foundry lands on Azure Stack

During today’s keynote, Pivotal announced that Pivotal Cloud Foundry is officially coming to Azure Stack in beta, expanding Azure’s longstanding support for Pivotal Cloud Foundry to include hybrid scenarios. The addition of Azure Stack support enables you to deploy apps written using any language and framework, including Java and Spring, to the public or private cloud securely and easily with Pivotal Cloud Foundry.

Pivotal and Microsoft have been working together to offer a consist experience to avoid “snowflake environments”. For example, Pivotal Cloud Foundry uses the same operations manager and provisioning agent for Azure Stack and the public Azure cloud. You can also use the Open Service Broker for Azure in Pivotal Cloud Foundry on Azure Stack to connect to services on the public Azure cloud like Cosmos DB, Service Bus, and more.

Pivotal Cloud Foundry and Azure

Lighter image for Pivotal Cloud Foundry on the Azure Marketplace

We know that the Azure Marketplace is a valuable way for you to provision software in the cloud. That’s why we’re pleased that Pivotal chose the Azure Marketplace as the first place to offer a new, lightweight image of Pivotal Cloud Foundry.

The Small Footprint Runtime offers very similar functionality to the traditional image, but requires 70% fewer VMs. This is great for small environments like proof-of-concepts, edge locations, or departmental solutions that want velocity, but with the smallest infrastructure possible.

Azure Services in Spring Initializr

Spring Initializr enables developers to handle the dependency management and make the bootstrapping process for Spring projects much easier. Today, in collaboration with Pivotal, we're excited to announce new Spring Boot Starters for Azure, providing Java developers a shortcut to apply Spring technologies to Azure.

Spring Initializr

Java developers can now get started with their Spring applications on Azure quickly by typing "Azure" inside Spring Initializr to choose the dependencies for Azure services, or by selecting options they want to include from the new Azure section on the full version of the site. You can also access Azure dependencies from the cf CLI, Visual Studio Code, Eclipse, and IntelliJ. All of our Spring Boot support is open source on GitHub.

At launch, we are offering the following Spring Starters for Azure, with more to come:

  • Azure Support: Provides support for the Azure services below, plus all other services currently available via Spring Boot Starters.
  • Azure Active Directory: Enterprise grade authentication using Azure Active Directory.
  • Azure Key Vault: Manage application secrets using Azure Key Vault.
  • Azure Storage: Integration with Azure Storage including object storage, queues, tables, and more.

Using Visual Studio Code to develop and debug Java Functions

Just a couple of months ago, at JavaOne, we announced the preview of Java support for Azure Functions, our serverless platform. During the preview, we’ve heard a lot of great suggestions from the Java community and have made some key improvements and added new features, including binary data support and specialized data types for HTTP and metadata. More details could be found in our developer guide.

In addition to the service running on Azure, we’ve also upgraded the developer tools to make developing Java Functions on Azure more enjoyable. In particular, we are announcing today two new features for developing Java Functions:

  • Remote debugging support: Since the launch, developers have been able test and debug Java Functions using an emulator in their local development environment. With today’s update, the Visual Studio Code debugger can now attach to Functions running on Azure, remotely, for more complex and production-like scenarios.
  • Azure Functions extension in Visual Studio Code: With this extension, you can easily develop, test and deploy Java Functions to Azure, directly within Visual Studio Code, our free, open-source editor for Windows, macOS and Linux, as well as managing existing Functions on the cloud. Visual Studio Code also provides awesome editing and debugging experience for Java developers, with features like IntelliSense, linting, and peek/goto definition.

All those new features and tools are available now and you can follow our tutorial to give it a try.

Spring Boot extensions for Visual Studio Code

Lastly, we’re happy to report that at SpringOne Platform, Pivotal shared a new set of Visual Studio Code extensions that add first-class support for Spring Boot developers. Pivotal has invested in making Spring Boot development easier for developers using all editors, including Visual Studio Code.

With the new extensions from Pivotal, you get full code-completion support, validation and assistance for application property files, navigation shortcuts, and the ability to inspect running apps. Combine that with the Spring Initializr support mentioned above, and you can quickly initiate, develop, and deploy applications anywhere, including Pivotal Cloud Foundry on Azure and Azure Stack.

Transforming organizations with open source software

We know developers and companies come to SpringOne Platform to share knowledge and collaborate around the goal of transforming organizations with software, which the cloud, both public and private, enables.

Unsurprisingly, open source plays an important role in those cloud-native applications and when it comes to real-life use cases in the enterprise, Java plays a very special role as well. For example, in one of our case studies you can read how Merrill Corporation used Spring Cloud and Spring Boot to dramatically accelerate how they delivered value. Merrill’s DatasiteOne was built in less than a year, compared to a normal 3 year cycle, and updates were pushed daily, compared to a usual 5-week cycle.

Moving forward

We’re excited about all of the announcements that are coming out of SpringOne Platform from both Microsoft and Pivotal. We’re working to make Azure a great platform for all developers, including those working with Java and Spring, enabling them to deploy to virtual machines, container, Functions and third-party platforms like Pivotal Cloud Foundry. We’re also enabling first-class hybrid scenarios with Azure Stack.

If you’re building apps in Spring, check out our developer hub for Spring on Azure, including how to use the new Azure starters in Spring Initializr. You can also adopt the serverless pattern and build your first Azure Function in Java with our free Azure trial.

Announcing the general availability of B-Series and M-Series

$
0
0

In addition to the new Lv2 size announcement from earlier today, I am also excited to share two GA sizes available today:

  • We’re announcing general availability (GA) of the B-Series VMs.
  • We are announcing GA of the Azure M-Series, the VM family with the largest CPU and memory sizes, with up to 4 TB of RAM.

B-Series general availability

Earlier in September, we announced the preview of the burstable size called the B-Series. I am excited to share that B-Series is now generally available. B-series VMs provide the lowest cost option for customers with flexible vCPU requirements. These are useful for workloads like web servers, small databases, and development or test environments where CPU utilization is low most of the time but spikes for short durations. B-Series VMs offer consistent baseline CPU performance and let you build up credits which can be used for peak CPU usage. These sizes give you extreme cost flexibility and flexible value.

The B-Series VMs are available in the following sizes:

Size vCPU’s Memory: GiB Local SSD: GiB Baseline CPU Performance of VM Max CPU Performance of VM
Standard_B1s 1 1 4 10% 100%
Standard_B1ms 1 2 4 20% 100%
Standard_B2s 2 4 8 40% 200%
Standard_B2ms 2 8 16 60% 200%
Standard_B4ms 4 16 32 90% 400%
Standard_B8ms 8 32 64 135% 800%


For more information regarding B-Series VM capabilities and pricing please visit our Azure B-Series documentation.

These sizes are available in East US, East US2, West US, Central US, North Central US, South Central US, North Europe, West Europe, Southeast Asia, Japan West, Australia East, Australia South East, Central India, Canada Central, Canada East, West US2, UK South, UK West and Korea Central. We will continue to add additional regions in the coming months.

M-Series GA and the new 4TB size

Today, we are releasing the GA of the M-Series that provides the largest VM sizes in Azure. With the M-series, you can now deploy up to 3.8 TiB (4 TB) of RAM on a single VM. These VMs offer up to 128 hyper-threaded vCPUs, powered by Intel® Xeon® 2.5 GHz E7-8890 v3 processors. This newly released M-series size adds to our already impressive set of sizes offering large amounts of memory, including the purpose-built SAP HANA Large Instances, offering up to 20 TB of memory, the most offered by any public cloud. 

The Azure M-series is perfectly suited for your large in-memory workloads like SAP HANA and SQL Hekaton. With the M-series, these databases can load large datasets into memory and utilize the fast memory access with huge amounts of vCPU parallel processing to speed up queries and enable real-time analytics. You can deploy these large workloads in minutes and on-demand, scaling elastically as your usage demands. With availability SLAs of 99.95% for an Availability Set, 99.9% for a single node, and 99.99% when we GA Availability Zones, you can provide application level SLA guarantees to your users for both your HA and scale-out configurations. Like all Azure VMs, you will be billed per-second (rounded down to the nearest minute) and you can even set-up automation on the platform to make sure you shut down and scale these VMs automatically, saving even more cost. 

The M-Series VMs are available in the following sizes:

Size vCPU’s Memory (GiB) Local SSD (GiB) Max data disks
M64s 64 1024 2048 32
M64ms 64 1792 2048 32
M128s 128 2048 4096 64
M128ms 128 3800 4096 64

You can get more information on the M-series VM sizes here. To request access to the M-series, submit your request quota in the supported region. After your quota has been approved, you can use the Azure portal or API’s to deploy. 

You can learn more about running SAP support on Azure here: https://azure.com/sap/.

We are launching the M-series in the following regions, with more regions available in the coming months: West US 2, East US 2, and West Europe

See ya around,

Corey

On the biases in data

$
0
0

Whether we're developing statistical models, training machine learning recognizers, or developing AI systems, we start with data. And while the suitability of that data set is, lamentably, sometimes measured by its size, it's always important to reflect on where those data come from. Data are not neutral: the data we choose to use has profound impacts on the resulting systems we develop. A recent article in Microsoft's AI Blog discusses the inherent biases found in many data sets:

“The people who are collecting the datasets decide that, ‘Oh this represents what men and women do, or this represents all human actions or human faces.’ These are types of decisions that are made when we create what are called datasets,” she said. “What is interesting about training datasets is that they will always bear the marks of history, that history will be human, and it will always have the same kind of frailties and biases that humans have.”
Kate Crawford, Principal Researcher at Microsoft Research and co-founder of AI Now Institute.

“When you are constructing or choosing a dataset, you have to ask, ‘Is this dataset representative of the population that I am trying to model?’”
Hanna Wallach, Senior Researcher at Microsoft Research NYC. 

The article discusses the consequences of the data sets that aren't representative of the populations they are set to analyze, and also the consequences of the lack of diversity in the fields of AI research and implementation. Read the complete article at the link below.

Microsoft AI Blog: Debugging data: Microsoft researchers look at ways to train AI systems to reflect the real world

Introducing the Web Media Extension Package with OGG Vorbis and Theora support for Microsoft Edge

$
0
0

We’ve heard requests from many of our customers to support additional open-source formats in order to access a broader set of content on the web. To address this, ,we recently added support for the WebM container format and the VP9 and Opus codecs on supported hardware.

Today, we’re excited to announce a new mechanism which will allow our customers to add more formats on demand and increase our agility to add new formats in the future: Media Extensions. Alongside this mechanism, we’re releasing the Web Media Extensions package to the Microsoft Store as a free Media Extension for Microsoft Edge.

Media Extensions

Media on the web has been evolving at a furious rate for the last few years. Adaptive video streaming is now common, providing a simpler mechanism for professional-quality video under changing network and device conditions; HTML5 Premium Media provides the tools for interoperable, plugin-free protected media; plugin-free video and audio conferencing is now routine with tools like WebRTC and ORTC.

We’re proud to be at the leading edge of these features, providing a modern set of capabilities with more efficient and higher quality video in Microsoft Edge. At the same time, we’re always looking to make sure Microsoft Edge meets the needs of our customers and web developers alike, and to provide a seamless playback experience on the web.  The rapid growth in media capabilities has naturally resulted in a need to support more media formats in web browsers.

Media Extensions are Media Foundation components designed to extend the core Windows platform and enable Windows apps including Microsoft Edge to support an ever-increasing range of formats. Media Extensions, much like browser extensions, allow customers to extend their device beyond the core experience shipped as part of Windows 10. It also allows the developers of media technologies to update and enhance media components independently of the Windows 10 release schedule. This allows us to work with the community to deliver high quality, interoperable codecs to Edge customers quickly and reliably.

The Web Media Extensions Package

The Web Media Extensions package adds support for the open source OGG container and the Theora and Vorbis codecs, and it expands support for WebM VP9 to work with Theora in simple video elements.  Our support for these formats is based on proven implementations from the well-known FFmpeg codecs using the FFmpeg Interop library. We expect this set of formats to be useful for enthusiasts and customers with specific format needs and we’re excited to bring support for these FFmpeg formats to Microsoft Edge!

Our initial release of the Web Media Extension package is focused on supporting these developers and customers who know they need support for these formats – the seekers and enthusiasts on the web. In the spirit of flighting, this will allow us to learn and improve based on your feedback before we expand support to the broader range of Edge customers on the market today. Long-term, we expect to expand distribution of the Web Media Extension package to all Windows 10 devices so that these formats become a trusted and reliable part of the web platform available to developers.

Getting started

Developers and customers can get started with these new formats in Microsoft Edge by simply installing the Web Media Extension Package from the Microsoft Store. You can also find the package under the Microsoft Edge Extensions collection in the store. This package extends the base media platform in Windows, so the formats will be available to Windows apps and Microsoft Edge with no further action from the user.

We encourage you to install the extension and try it out today! Going forward, we intend to expand distribution, release more formats as Extensions and work with third parties on new formats for Microsoft Edge – your usage will help validate this approach and help us identify potential issues as we evaluate opportunities to provide these capabilities to our customers.

We’re passionate about providing a high-quality, interoperable media experience in Microsoft Edge. This extension package is a first step forward broadening Microsoft Edge’s playback capabilities while providing new mechanisms for us to deliver expanded support in response to the diverse needs of customers, devices, and different browsing contexts. We look forward to hearing your feedback as we work with the community to move our media platform forward!

— David Mebane, Senior Program Manager, Windows Media Platform
 Jerry Smith, Senior Program Manager, Microsoft Edge

The post Introducing the Web Media Extension Package with OGG Vorbis and Theora support for Microsoft Edge appeared first on Microsoft Edge Dev Blog.

Viewing all 10804 articles
Browse latest View live


<script src="https://jsc.adskeeper.com/r/s/rssing.com.1596347.js" async> </script>