Quantcast
Channel: Category Name
Viewing all 10804 articles
Browse latest View live

Eight new features in Azure Stream Analytics

$
0
0

This week at Microsoft Ignite 2018, we are excited to announce eight new features in Azure Stream Analytics (ASA). These new features include

    • Support for query extensibility with C# custom code in ASA jobs running on Azure IoT Edge.
    • Custom de-serializers in ASA jobs running on Azure IoT Edge.
    • Live data Testing in Visual Studio.
    • High throughput output to SQL.
    • ML based Anomaly Detection on IoT Edge.
    • Managed Identities for Azure Resources (formerly MSI) based authentication for egress to Azure Data Lake Storage Gen 1.
    • Blob output partitioning by custom date/time formats.
    • User defined custom re-partition count.

The features that are generally available and the ones in public preview will start rolling imminently. For early access to private preview features, please use our sign up form.

Also, if you are attending Microsoft Ignite conference this week, please attend our session BRK3199 to learn more about these features and see several of these in action.

General availability features

Parallel write operations to Azure SQL

Azure Stream Analytics now supports high performance and efficient write operations to Azure SQL DB and Azure SQL Data Warehouse to help customers achieve four to five times higher throughput than what was previously possible. To achieve fully parallel topologies, ASA will transition SQL writes from serial to parallel operations while simultaneously allowing for batch size customizations. Read Understand outputs from Azure Stream Analytics for more details.

Parallel write operations to Azure SQL

Configuring hi-throughput write operation to SQL

Public previews

Query extensibility with C# UDF on Azure IoT Edge

Azure Stream Analytics offers a SQL-like query language for performing transformations and computations over streams of events. Though there are many powerful built-in functions in the currently supported SQL language, there are instances where a SQL-like language doesn't provide enough flexibility or tooling to tackle complex scenarios.

Developers creating Stream Analytics modules for Azure IoT Edge can now write custom C# functions and invoke them right in the query through User Defined Functions.  This enables scenarios like complex math calculations, importing custom ML models using ML.NET and programming custom data imputation logic. Full fidelity authoring experience is made available in Visual Studio for these functions. You can install the latest version of Azure Stream Analytics tools for Visual Studio.

Find more details about this feature in our documentation.

image

Definition of the C# UDF in Visual Studio

image

Calling the C# UDF from ASA Query

Output partitioning to Azure Blob Storage by custom date and time formats

Azure Stream Analytics users can now partition output to Azure Blob storage based on custom date and time formats.
This feature greatly improves downstream data-processing workflows by allowing fine-grained control over the blob output especially for scenarios such as dashboarding and reporting. In addition, partition by custom date and time formats enables stronger alignment with downstream Hive supported formats and conventions when consumed by services such as Azure HDInsight or Azure Databricks. Read Understand outputs from Azure Stream Analytics for more details.

custom date Output partitioning to Azure Blob Storage by custom date and time formatstime

Partition by custom date or time on Azure portal

Ability to partition output to Azure Blob storage by custom field or attribute continues to be in private preview.

image

Setting partition by custom attribute on Azure portal

Live data testing in Visual Studio

Available immediately, Visual Studio tooling for Azure Stream Analytics further enhances the local testing capability to help users test their queries against live data or event streams from cloud sources such as Azure Event Hubs or IoT hub. This includes full support for Stream Analytics time policies in local simulated Visual Studio IDE environment.

This significantly shortens development cycles as developers no longer need to start/stop their job to run test cycles. Also, this feature provides a fluent experience for checking the live output data while the query is running. You can install the latest version of Azure Stream Analytics tools for Visual Studio.

Live data testing in Visual Studio

Live Data Testing in Visual Studio IDE

User defined custom re-partition count

We are extending our SQL language to optionally enable users to specify the number of partitions of a stream when performing repartitioning. This will enable better performance tuning for scenarios where the partition key can’t be changed to upstream constraints, or when we have fixed number of partitions for output, or partitioned processing is needed to scale out to larger processing load. Once repartitioned, each partition is processed independently of others.

With this new language feature, query developer can simply use a newly introduced keyword INTO after PARTITION BY statement. For example, the query below reads from the input stream (regardless of it being naturally partitioned) and repartition the stream into 10 based on the DeviceID dimension and flush the data to output.

SELECT * INTO [output] FROM [input] PARTITION BY DeviceID INTO 10


Private previews – Sign up for previews


Built-in models for Anomaly Detection on Azure IoT Edge and cloud

By providing ready-to-use ML models right within our SQL-like language, we empower every developer to easily add Anomaly Detection capabilities to their ASA jobs, without requiring them to develop and train their own ML models. This in effect reduces the whole complexity associated with building ML models to a simple single function call.

Currently, this feature is available for private preview in cloud, and we are happy to announce that these ML functions for built-in Anomaly Detection are also being made available for ASA modules running on Azure IoT Edge runtime. This will help customers who demand sub-second latencies, or within scenarios where connectivity to cloud is unreliable or expensive.

In this latest round of enhancements, we have been able to reduce the number of functions from five to two while still detecting all five kinds of anomalies of Spike, Dip, Slow positive increase, Slow negative decrease, and Bi-level changes. Also, our tests are showing a remarkable five to ten times improvement in performance.

Sedgwick is a global provider of technology enabled risk, benefits and integrated business solutions who has been engaged with us as an early adopter for this feature.

“Sedgwick has been working directly with Stream Analytics engineering team to explore and operationalize compelling scenarios for Anomaly Detection using built-in functions in the Stream Analytics Query language. We are convinced this feature holds a lot of potential for our current and future scenarios”.

– Krishna Nagalapadi, Software Architect, Sedgwick Labs.

Custom de-serializers in Stream Analytics module on Azure IoT Edge

Today, Azure Stream Analytics supports input events in JSON, CSV or AVRO data formats out of the box. However, millions of IoT devices are often optimized to generate data in other formats to encode structured data in a more efficient yet extensible format.

Going forward, IoT devices sending data in any format can leverage the power of Azure Stream Analytics. Be it Parquet, Protobuf, XML or any binary format. Developers can now implement custom de-serializers in C# which can then be used to de-serialize events received by Azure Stream Analytics.

Custom de-serializers in Stream Analytics module on Azure IoT Edge

Configuring input with a custom serialization format

Managed identities for Azure resources (formerly MSI) based authentication for egress to Azure Data Lake Storage Gen 1

Users of Azure Stream Analytics will now be able to operationalize their real-time pipelines with MSI based authentication while writing to Azure Data Lake Storage Gen 1.

Previously, users depended on Azure Active Directory based authentication for this purpose, which had several limitations.  For instance, users will now be able to automate their Stream Analytics pipelines through PowerShell. Secondly, this allows users to have long running jobs without being interrupted for sign-in renewals periodically. Finally, this makes user experience consistent across almost all ingress and egress services that are integrated out-of-the-box with Stream Analytics.

Managed identities for Azure resources (formerly MSI) - 2       Managed identities for Azure resources (formerly MSI) - 1

Configuring MSI based authentication to Data Lake Storage

Feedback

Engage with us, and get preview of new features by following our twitter handle @AzureStreaming.

Azure Stream Analytics team is highly committed to listening to your feedback and letting the user voice dictate our future investments. Please join the conversation and make your voice heard via our UserVoice.


Announcing the EA preview release of management group cost APIs

$
0
0

We are excited to preview a set of Azure Resource Manager Application Program Interfaces (ARM APIs) to view cost and usage information in the context of a management group for Enterprise Customers. Azure customers can utilize management groups today to place subscriptions into containers for organization within a defined business hierarchy. This allows administrators to manage access, policies, and compliance over those subscriptions. These APIs expand your cost analysis capabilities by offering a new lens through which you can attribute cost and usage within your organization.

Calling the APIs

The APIs for management group usage and cost are documented in the Azure rest docs and support the following functions:

Operations supported

  1. List usage details by management group for native Azure resources
  2. Get the aggregate cost of a management group

Preview limitations

The preview release of the management group cost and usage APIs has several limitations, listed below:

  1. Cost and usage data by management group will only be returned if the management group is comprised of exclusively Enterprise Agreement subscriptions. Cost views for a management group are not supported if the group contains Web Direct, Pay-As-You-Go or Cloud Service Provider subscriptions. This functionality will be offered in a future release.
  2. Cost and usage data for a management group is a point in time snapshot of the current management group hierarchy. The cost and usage data returned will not take into account any past changes or reorganization within the management group hierarchy.
  3. Cost and usage data for a management group will only be returned if the underlying charges and data are billed in a single currency. Support for multiple currencies will be available in a future release.

Additional resources

Strengthen your security posture and protect against threats with Azure Security Center

$
0
0

In my recent conversations with customers, they have shared the security challenges they are facing on-premises. These challenges include recruiting and retaining security experts, quickly responding to an increasing number of threats, and ensuring that their security policies are meeting their compliance requirements.

Moving to the cloud can help solve these challenges. Microsoft Azure provides a highly secure foundation for you to host your infrastructure and applications while also providing you with built-in security services and unique intelligence to help you quickly protect your workloads and stay ahead of threats. Microsoft’s breadth of security tools range span across identity, networking, data, and IoT and can even help you protect against threats and manage your security posture. One of our integrated, first-party services is Azure Security Center.

Security Center is built into the Azure platform, making it easy for you start protecting your workloads at scale in just a few steps. Our agent-based approach allows Security Center to continuously monitor and assess your security state across Azure, other clouds and on-premises. It’s helped customers like Icertis or Stanley Healthcare strengthen and simplify their security monitoring. Security Center gives you instant insight into issues and the flexibility to solve these challenges with integrated first-party or third-party solutions. In just a few clicks, you can have peace of mind knowing Security Center is enabled to help you reduce the complexity involved in security management.

Today we are announcing several capabilities that will help you strengthen your security posture and protect against threats across hybrid environments.

Strengthen your security posture

Improve your overall security with Secure Score: Secure Score gives you visibility into your organizational security posture. Secure Score prioritizes all of your recommendations across subscriptions and management groups guiding you which vulnerabilities to address first. When you quickly remediate the most pressing issues first, you can see how your actions greatly improve your Secure Score and thus your security posture.

Secure Score

Interact with a new network topology map: Security Center now gives you visibility into the security state of your virtual networks, subnets and nodes through a new network topology map. As you review the components of your network, you can see recommendations to help you quickly respond to detected issues in your network. Also, Security Center continuously analyzes the network security group rules in the workload and presents a graph that contains the possible reachability of every VM in that workload on top of the network topology map.

Network map

Define security policies at an organizational level to meet compliance requirements: You can set security policies at an organizational level to ensure all your subscriptions are meeting your compliance requirements. To make things even simpler, you can also set security policies for management groups within your organization. To easily understand if your security policies are meeting your compliance requirements, you can quickly view an organizational compliance score as well as scores for individual subscriptions and management groups and then take action.

Monitor and report on regulatory compliance using the new regulatory compliance dashboard: The Security Center regulatory compliance dashboard helps you monitor the compliance of your cloud environment. It provides you with recommendations to help you meet compliance standards such as CIS, PCI, SOC and ISO.

Regulatory Compliance

Customize policies to protect information in Azure data resources: You can now customize and set an information policy to help you discover, classify, label and protect sensitive data in your Azure data resources. Protecting data can help your enterprise meet compliance and privacy requirements as well as control who has access to highly sensitive information. To learn more on data security, visit our documentation.

Assess the security of containers and Docker hosts: You can gain visibility into the security state of your containers running on Linux virtual machines. Specifically, you can gain insight into the virtual machines running Docker as well as the security assessments that are based on the CIS for Docker benchmark.

Protect against evolving threats

Integration with Windows Defender Advanced Threat Protection servers (WDATP): Security Center can detect a wide variety of threats targeting your infrastructure. With the integration of WDATP, you now get endpoint threat detection (i.e. Server EDR) for your Windows Servers as part of Security Center. Microsoft’s vast threat intelligence enables WDATP to identify and notify you of attackers’ tools and techniques, so you can understand threats and respond. To uncover more information about a breach, you can explore the details in the interactive Investigation Path within Security Center blade. To get started, WDATP is automatically enabled for Azure and on-premises Windows Servers that have onboarded to Security Center.

Threat detection for Linux: Security Center’s advanced threat detection capabilities are available across a wide variety of Linux distros to help ensure that whatever operation system your workloads are running on or wherever your workloads are running, you gain the insights you need to respond to threats quickly. Capabilities include being able to detect suspicious processes, dubious login attempts, and kernel module tampering.

Adaptive network controls: One of the biggest attack surfaces for workloads running in the public cloud are connections to and from the public internet. Security Center can now learn the network connectivity patterns of your Azure workload and provide you with a set of recommendations for your network security groups on how to better configure your network access policies and limit your exposure to attack. These recommendations also use Microsoft’s extensive threat intelligence reports to make sure that known bad actors are not recommended.

Threat Detection for Azure Storage blobs and Azure Postgre SQL: In addition to being able to detect threats targeting your virtual machines, Security Center can detect threats targeting data in Azure Storage accounts and Azure PostgreSQL servers. This will help you respond to unusual attempts to access or exploit data and quickly investigate the problem.

Security Center can also detect threats targeting Azure App Services and provide recommendations to protect your applications.

Fileless Attack Detection: Security Center uses a variety of advanced memory forensic techniques to identify malware that persists only in memory and is not detected through traditional means. You can use the rich set of contextual information for alert triage, correlation, analysis and pattern extraction.

Adaptive application controls: Adaptive applications controls helps you audit and block unwanted applications from running on your virtual machines. To help you respond to suspicious behavior detected with your applications or deviation from the policies you set, it will now generate an alert in the Security alerts if there is a violation of your whitelisting policies. You can now also enable adaptive application controls for groups of virtual machines that fall under the “Not recommend” category to ensure that you whitelist all applications running on your Windows virtual machines in Azure.

Just-in-Time VM Access: With Just-in-Time VM Access, you can limit your exposure to brute force attacks by locking down management ports, so they are only open for a limited time. You can set rules for how users can connect to these ports, and when someone needs to request access. You can now ensure that the rules you set for Just-in-Time VM access will not interfere with any existing configurations you have already set for your network security group.

File Integrity Monitoring (FIM): To help protect your operation system and application software from attack, Security Center is continuously monitoring the behavior of your Windows files, Windows registry and Linux files. For Windows files, you can now detect changes through recursion, wildcards, and environment variables. If some abnormal change to the files or a malicious behavior is detected, Security Center will alert you so that you can continue to stay in control of your files.

Start using Azure Security Center’s new capabilities today

The following capabilities are generally available: Enterprise-wide security policies, Adaptive application controls, Just-in-Time VM Access for a specific role, adjusting network security group rules in Just-in-Time VM Access, File Integrity Monitoring (FIM), threat detection for Linux, detecting threats on Azure App Services, Fileless Attack Detection, alert confidence score, and integration with Windows Defender Advanced Threat Protection (ATP).

These features are available in public preview: Security state of containers, network visibility map, information protection for Azure SQL, threat detection for Azure Storage blobs and Azure Postgre SQL and Secure Score.

We are offering a limited public preview for some capabilities like our compliance dashboard and adaptive network controls. Please contact us to participate in this early preview.

Learn more about Azure Security Center

If you are attending Ignite 2018 in Orlando this week, we would love to connect with you at our Azure security booth. You can also attend session on Azure Security Center on Wednesday, September 26th from 2:15-3pm EST. We look forward to seeing you!

To learn more about how you can implement these Security Center capabilities, visit our documentation.

Step Back – Going Back in C++ Time

$
0
0

Step Back for C++

In the most recent, 15.9, update to Visual Studio 2017 Enterprise Edition, we’ve added “Step Back” for C++ developers targeting Windows 10 Anniversary Update (1607) and later. With this feature, you can now return to a previous state while debugging without having to restart the entire process. It’s installed as part of the C++ workload but set to “off” by default. To enable it, go to Tools -> Options -> IntelliTrace and select the “IntelliTrace snapshots” option. This will enable snapshots for both Managed and Native code.

Once “Step Back” is enabled, you will see snapshots appear in the Events tab of the Diagnostic Tools Window when you are stepping through C++ code.

Clicking on any event will take you back to its respective snapshot – which is a much more productive way to go back in time if you want to go further back than a few steps. Or, you can simply use the Step Backward button on the debug command bar to go back in time. You can see “Step Back” in action in concurrence with “Step Over” in the gif below.

Under the Hood

So far, we’ve talked about “Step Back” and how you can enable and use it in Visual Studio, but you could have read that on the VS blog. Here on the VC++ blog, I thought it would be interesting to explain how the feature works and what the trade offs are. After all, no software, debuggers included, are magical!

At the core of “Step Back” is an API in Windows called PssCaptureSnapshot (docs). While the API isn’t very descriptive, there are two key things that it does to a process. Given a target process it will:

  1. Create a ‘snapshot’ which looks suspiciously like the child process of an existing process that has no threads running.
  2. Mark the processes memory, it’s page tables (Wikipedia), as copy-on-write (Wikipedia). That means that whenever a table is written to, the table is copied.

The important thing about the above is that between the two you basically get a copy of the entire virtual memory space used by the process that you snapshotted. From inside that process you can then inspect the state, the memory, of the application as it was at the time the snapshot was created. This is handy for the feature which the API was originally designed for; the serialization of a process at the point of failure .

In VS when debugging C++, we take these snapshots on certain debugger events, namely:

  1. When a breakpoint is hit
  2. When a step event occurs – but only if the time between the stepping action and the previous stepping action is above a certain threshold (around ~300ms). This helps with the case where you are hammering the stepping buttons and just want to step at all possible speed.

From a practical perspective, that means there will be a snapshot as you step through code. We keep a First in First Out buffer of snapshots, freeing them up as more are taken. One of the downsides of this approach, is that we aren’t taking snapshots as your app is running so you can’t hit a breakpoint and then go back to see what happened before the breakpoint was hit.

Now there is a copy of the process, a snapshot, but how does that get debugged in VS?

Well, this is the ‘easy’ bit, basically when you hit “Step Back” or activate a snapshot from the Diagnostic Tools window, VS goes ahead and attaches the debugger to that process. We hide this from you in the VS UI, so it still looks like you are debugging the process you started with, but in reality, you are debugging the snapshot process with all the state from the past. Once you go back to ‘live’ debugging you will back to the main process which is still paused at the location you left it.

Performance of Step Back

One of the first considerations of adding any new feature to the debugger is on how it might impact the performance of VS while debugging. While improving performance of VS is something of a Sisyphean task and as many improvements as we make there is more to be made as well as additional features that take some of those wins. Taking a snapshot takes time, everything does, in this case it takes time both in the process being debugged and back in VS. There’s no sure way to predict how long it will take as it’s dependent on the app and how it’s using memory, but while we don’t have a magic 8 ball, we do have data, lots of it…

As of the time of writing, from testing and dogfooding usage in the last 28 days use we’ve seen 29,635,121 snapshots taken across 14,738 machines. From that data set we can see that the 75th percentile for how long it took to take a snapshot is 81ms. You can see a more detailed breakdown in the graph below.


In any case, if you were wondering why “Step Back” isn’t on by default, that graph above is why, “Step Back” simply impacts stepping performance too much to be on by default, all the time, for everyone. Instead, it’s a tool that you should decide to use and, by and large, you’ll likely never notice the impact. Though, if you did we will turn off “Step Back” and show a ‘gold bar’ notification that we’ve done so. The ‘gold bars’ are the notifications that pop at the top of the editor, the picture below shows the one for when you try “Step Back” without snapshots being enabled.
That’s the CPU usage aspect of performance out the way, now to look at the second aspect, memory.

As you continue to debug your app and the app continues execution it will no doubt write to memory. This could be to set a value from 1 to 2 as in the example above. Or it could be something more complex, but in any case, when it comes time to write that change the OS is going to copy the associated page table to a new location. Duplicating the data that was changed, and potential other data, at the new location, while keeping the old. That new location will continue to be used. That means that the old location still has the old value, 1, from the time the snapshot was taken, and the new location has the value of 2. As Windows is now copying memory as it’s written, the app will consume more memory. How much though depends on the application and what it’s doing. The consumption of memory is directly proportional to how volatile it is. For example, in the trivial app above each step is going to consume a tiny bit more data. But, if the app instead were encoding an image or doing something intense a lot more memory would get consumed than would be typical.

Now as memory, even virtual, is finite this poses some limitations on step back. Namely that we can’t keep an infinite number of snapshots around. At some point we have to free them and their associated memory up. We do that in two ways; firstly, the snapshots are let go on a First in First out basis once a limit of a 100 has been reached. That is, you can never step back more than a 100x. That cap is arbitrary though, a magic number. There’s an additional cap that’s enforced and based on heuristics, essentially VS is watching memory usage and in the event of low memory snapshots get dropped starting with the oldest – just as if a 100 was hit.

Conclusion

We’ve covered how you can use “Step Back” and how it works under the hood and hopefully you are now in a place to make an informed decision on when to use the feature. While this feature is only in the Enterprise versions of Visual Studio you can always try out the preview channel of Visual Studio Enterprise. I highly recommend you go turn it on, for me, personally it’s saved a whole bunch of time not restarting a debug session. And when you do use the feature I’d love to hear your feedback, and as ever if you have any feedback on the debugger experience in VS let us know!

You can also reach me by mail at andster@microsoft.com)or on twitter at https://twitter.com/andysterland.

Thanks for reading!

Andy Sterland

Program Manager, Visual Studio, Diagnostics Team

Getting started writing Visual Studio extensions

$
0
0

I’m often asked how to best learn to build Visual Studio extensions, so here is what I wished someone told me before I got started.

Don’t skip the introduction

It’s easy to create a new extensibility project in Visual Studio, but unless you understand the basics of how the extensibility system works, then you are setting yourself up for failure.

The best introduction I know of is a session from //build 2016 and it is as relevant today as it was then.


Know the resources

Where do you get more information about the various aspects of the Visual Studio APIs you wish to use? Here are some very helpful websites that are good to study.

Know how to search for help

Writing extensions is a bit of a niche activity so searching for help online doesn’t always return relevant results. However, there are ways we can optimize our search terms to generate better results.

  • Use the precise interface and class names as part of the search term
  • Try adding the words VSIX, VSSDK or Visual Studio to the search terms
  • Search directly on GitHub instead of Google/Bing when possible
  • Ask questions to other extenders on the Gitter.im chatroom

Use open source as a learning tool

You probably have ideas about what you want your extension to do and how it should work. But what APIs should you use and how do you hook it all up correctly? These are difficult questions and a lot of people give up when these go unanswered.

The best way I know of is to find extensions on the Marketplace that does similar things or uses similar elements as to what you want to do. Then find the source code for that extension and look at what they did and what APIs they used and go from there.

Additional tools

There is an open source extension for Visual Studio that provides additional features for extension authors that I can highly recommend. Grab the Extensibility Essentials extension on the Marketplace.

Also, a NuGet package exist containing Roslyn Analyzers that will help you writing extensions. Add the Microsoft.VisualStudio.SDK.Analyzers package to your extension project.

I hope this will give you a better starting point for writing extensions. If I forgot to mention something, please let me know in the comments.

Mads Kristensen, Senior Program Manager
@mkristensenMads Kristensen is a senior program manager on the Visual Studio Extensibility team. He is passionate about extension authoring, and over the years, he’s written some of the most popular ones with millions of downloads.

How to upgrade extensions to support Visual Studio 2019

$
0
0

Recently, I’ve updated over 30 of my extensions to support Visual Studio 2019 (16.0). To make sure they work, I got my hands on a very early internal build of VS 2019 to test with (working on the Visual Studio team has its benefits). This upgrade process is one of the easiest I’ve ever experienced.

I wanted to share my steps with you to show just how easy it is so you’ll know what to do once Visual Studio 2019 is released.

Updates to .vsixmanifest

We need to make a couple of updates to the .vsixmanifest file. First, we must update the supported VS version range.

<InstallationTarget>

Here’s a version that support every major and minor versions of Visual Studio 14.0 (2015) and 15.0 (2017) all the way up to but not including version 16.0.

<Installation InstalledByMsi="false"> 
    <InstallationTarget Id="Microsoft.VisualStudio.Pro" Version="[14.0,16.0)" /> 
</Installation>

Simply change the upper bound of the version range from 16.0 to 17.0, like so:

<Installation InstalledByMsi="false"> 
    <InstallationTarget Id="Microsoft.VisualStudio.Pro" Version="[14.0,17.0)" /> 
</Installation>
<Prerequisite>

Next, update the version ranges in the <Prerequisite> elements. Here’s what it looked like before:

<Prerequisites> 
    <Prerequisite Id="Microsoft.VisualStudio.Component.CoreEditor" Version="[15.0,16.0)" DisplayName="Visual Studio core editor" /> 
</Prerequisites>

We must update the version ranges to have the same upper bound as before, but in this case we can make the upper bound open ended, like so:

<Prerequisites> 
    <Prerequisite Id="Microsoft.VisualStudio.Component.CoreEditor" Version="[15.0,)" DisplayName="Visual Studio core editor" /> 
</Prerequisites>

This means that the Prerequisite needs version 15.0 or newer.

See the updated .vsixmanifest files for Markdown Editor, Bundler & Minifier, and Image Optimizer.

Next Steps

Nothing. That’s it. You’re done.

Well, there is one thing that may affect your extension. Extensions that autoload a package has to do so in the background as stated in the blog post, Improving the responsiveness of critical scenarios by updating auto load behavior for extensions. You can also check out this walkthrough on how to update your extension to use the AsyncPackage if you haven’t already.

What about the references to Microsoft.VisualStudio.Shell and other such assemblies? As always with new version of Visual Studio, they are automatically being redirected to the 16.0 equivalent and there is backwards compatibility to ensure it will Just WorkTM.  And in my experience with the upgrade is that they in fact do just work.

I’m going to head back to adding VS 2019 support to the rest of my extensions. I’ve got about 40 left to go.

Mads Kristensen, Senior Program Manager
@mkristensenMads Kristensen is a senior program manager on the Visual Studio Extensibility team. He is passionate about extension authoring, and over the years, he’s written some of the most popular ones with millions of downloads.

Microsoft Tops Four AI Leaderboards Simultaneously

$
0
0

Businesses are continuously trying to be more productive, while also better serving their customers and partners, and AI is one of the new technology areas they are looking at to help with this work. My colleague Alysa Taylor recently shared some of the work we are doing to help in this area with  our upcoming Dynamics 365 + AI offerings, a new class of business applications that will deliver AI-powered insights out of the box. These solutions help customers to make the transition from business intelligence (BI) to artificial intelligence (AI) to help address increasingly complex scenarios and derive actionable insights. Many of these new capabilities that will be shipping this October, are powered by breakthrough innovations from our world-class AI research & development teams who contribute to our products and participate in the broader research community by publishing their results.

This time last year, I wrote about the Stanford Question Answer Dataset (SQuAD) test for machine reading comprehension (MRC). Since writing that post, Microsoft reached another major milestone, creating a system that could read a document and answer as well as a human in the SQuAD 1.1 test. Although this is a test which is different than real world usage we find that the research innovations make our products better for our customers. Today I’d like to share an update on the next wave of innovation in natural language understanding and machine reading comprehension. Microsoft’s AI research and business engineering teams have now taken the top positions in three important industry competitions hosted by Salesforce, the Allen Institute for AI, and Stanford University. Even though the top spots on the leaderboards continuously change I would like to highlight some of our recent progress.

Microsoft tops Salesforce WikiSQL Challenge

Data stored in relational databases is the “fuel” that sales and marketing professionals tap to inform daily decisions. However, understanding how to get value from the data often requires deeply understanding the structure of the data. An easier approach is to use a natural language interface to query the data. Salesforce published a large crowd-sourced dataset based on Wikipedia, called WikiSQL, for developing and testing such interfaces. Over the last year many research teams have been developing techniques using this dataset and Salesforce has maintained a leaderboard for this purpose. Earlier this month, Microsoft took the top position on Salesforce’s leaderboard with a new approach called IncSQL. The significant improvement (from 81.4% to 87.1%) in test execution is due to a fundamentally novel incremental parsing approach combined with the idea of execution guided decoding detailed in the linked academic articles above. This work is the result of collaboration between scientists in Microsoft Research and in the Business Application Group.

WikiSQL Leaderboard

Microsoft tops Allen Institute for AI’s Reasoning Challenge (ARC)

The ARC question answering challenge, provides a dataset of 7,787 grade-school level, multiple-choice open domain questions designed to test approaches in question answering. Open domain is a more challenging approach for text understanding since the answer is not explicitly present. Models must first retrieve related evidence from large corpora before selecting the choice. This is a more realistic setting for a general-purpose application in this space. The top approach, essential term aware – retriever reader (ET-RR) was developed jointly by our Dynamics 365 + AI research team working with interns from the University of San Diego. The #3 position on the leaderboard is a separate research team comprised of Sun Yat-Sen University researchers and Microsoft Research Asia. Both results serve as a great reminder of the value of collaboration between academia and industry to solve real-world problems.
AI2 Reasoning Challenge

Microsoft tops new Stanford SQuAD 2.0 Reading Comprehension

In June 2018, SQuAD version 2.0 was released to “encourage the development of reading comprehension systems that know what they don’t know.”  Microsoft currently occupies the #1 position on SQuAD 2.0 and three of the top five rankings overall on, while simultaneously maintaining the #1 position on SQuAD 1.1. What’s exciting is how multiple positions are occupied by the Microsoft business applications group responsible for Dynamics 365 + AI demonstrating the benefits of infusing AI researchers in our engineering groups.

SQuAD 2.0 Leaderboard

These results show the breadth of MRC challenges our teams are researching and the rapid pace of innovation and collaboration in the industry. Combining researchers with engineering to tackle product challenges while participating in industry research challenges is shaping up to be a beneficial way to advance AI research and bring AI based solutions to customers more quickly.

Cheers,

Guggs

3-D shadow maps in R: the rayshader package

$
0
0

Data scientists often work with geographic data that needs to be visualized on a map, and sometimes the maps themselves are the data. The data is often located in two-dimensional space (latitude and longitude), but for some applications we have a third dimension as well: elevation. We could represent the elevations using contours, color, or 3-D perspective, but with the new rayshader package for R by Tyler Morgan-Wall, it's easy to visualize such maps as 3-D relief maps complete with shadows, perspective and depth of field:

👌 Dead-simple 3D surface plotting in the next version of rayshader! Apply your hillshade (or any image) to a 3D surface map. Video preview with rayshader's built-in palettes. #rstats

Code:

elmat %>%
sphere_shade() %>%
add_shadow(ray_shade(elmat)) %>%
plot_3d(elmat) pic.twitter.com/FCKQ9OSKpj

— Tyler Morgan-Wall (@tylermorganwall) July 2, 2018

Tyler describes the rayshader package in a gorgeous blog post: his goal was to generate 3-D representations of landscape data that "looked like a paper weight". (Incidentally, you can use this package to produce actual paper weights with 3-D printing.) To this end, he went beyond simply visualizing a 3-D surface in rgl and added a rectangular "base" to the surface as well as shadows cast by the geographic features. He also added support for detecting (or specifying) a water level: useful for representing lakes or oceans (like the map of the Monterey submarine canyon shown below) and for visualizing the effect of changing water levels like this animation of draining Lake Mead.

Raytracer

The rayshader package is implemented as an independent R package; it doesn't require any external 3-D graphics software to work. Not only does that make it easy to install and use, but it also means that the underlying computations are available for specialized data analysis tasks. For example, research analyst David Waldran used a LIDAR scan of downtown Indianapolis to create (with the lidR package) a 3-D map of the buildings, and then used the ray_shade function to simulate the shadows cast by the buildings at various times during a winter's day. Averaging those shadows yields this map of the shadiest winter spots in Indianapolis:

Indianapolis Winter

The rayshader package is available for download now from your local CRAN mirror. You can also find an overview, and the latest version of the package at the Github repository linked below.

Github (tylermorganwall): rayshader, R Package for Producing and Visualizing Hillshaded Maps from Elevation Matrices, in 2D and 3D


Healthcare Cloud Security Stack now available on Azure Marketplace

$
0
0

The success of healthcare organizations today is dependent on data-driven decision making. Inability to quickly access and process patient data due to outdated infrastructure may result in life or death situations. Healthcare organizations are making the shift to the cloud to enable better health outcomes. A critical part of that process is ensuring security and vulnerability management.

The Healthcare Cloud Security Stack for Microsoft Azure addresses these critical needs, helping entities use cloud services without losing focus on cybersecurity and HIPAA compliance. Healthcare Cloud Security Stack offers a continuous view of vulnerabilities and a complete security suite for cloud and hybrid workloads.

What is Healthcare Cloud Security Stack?

Healthcare Cloud Security Stack which is now available on Azure Marketplace, uses Qualys Vulnerability Management and Cloud Agents, Trend Micro Deep Security, and XentIT Executive Dashboard as a unified cloud threat management solution. Qualys cloud agents continuously collect vulnerability information and are mapped to Trend Micro Deep Security (TMDS) IPS.

Slide1

In the event that Qualys assesses a vulnerability and Deep Security has a virtual patch available, the Trend Micro Deep Security virtual patching engages until a physical patch is available and deployed. XentIT’s Executive Dashboard provides a single pane of glass into the vulnerabilities identified by Qualys. XentIT’S Executive Dashboard also provide the number and types of threats blocked by Trend Micro, as well as actionable intelligence for further investigation and remediation by security analysts and engineers.

The Healthcare Cloud Security Stack unified solution eliminates the overhead of security automation and orchestration after migration to the cloud resulting in:

  • Modernization of IT infrastructure while maintaining focus on cybersecurity and HIPAA compliance.
  • Gaining of actionable insights to proactively manage vulnerabilities.
  • Simplification of security management to free up resources for other priorities.

Learn more about Healthcare Cloud Security Stack on the Azure Marketplace, and look for more integrated solutions.

Spark Debugging and Diagnosis Toolset for Azure HDInsight

$
0
0

Debugging and diagnosing large, distributed big data sets is a hard and time-consuming process. Debugging big data queries and pipelines has become more critical for enterprises and includes debugging across many executors, fixing complex data flow issues, diagnosing data patterns, and debugging problems with cluster resources. The lack of enterprise-ready Spark job management capabilities constrains the ability of enterprise developers to collaboratively troubleshoot, diagnose and optimize the performance of workflows.

Microsoft is now bringing its decade-long experience of running and debugging millions of big data jobs to the open source world of Apache Spark. Today, we are delighted to announce the public preview of the Spark Diagnosis Toolset for HDInsight for clusters running Spark 2.3 and up. We are adding a set of diagnosis features to the default Spark history server user experience in addition to our previously released Job Graph and Data tabs. The new diagnosis features assist you in identifying low parallelization, detecting and running data skew analysis, gaining insights on stage data distribution, and viewing executor allocation and usage.

Data and time skew detection and analysis

Development productivity is the key for making enterprises technology teams successful. The Azure HDInsight developer toolset brings industry-leading development practices to big data developers working with Spark. Job Skew Analysis identifies data and time skews by analyzing and comparing data input and execution time across executors and tasks through built-in rules and user-defined rules. It increases productivity by automatically detecting skews, summarizing the diagnosis results, and displaying the task distribution between normal and skewed tasks.


image   

Executor Usage Analysis

Enterprises have to manage cost while maximizing performance of their production Spark jobs, especially given the rapidly increasing amount of data that needs to be analyzed. The Executor Usage Analysis tool visualizes the Spark job executors’ allocation and utilization. The chart displays the dynamic change of allocated executors, running executors and idle executors along with the job execution time. The executor usage chart serves as an easy to use reference for you to understand Spark job resource usage and so you can update configurations and optimize for performance or cost.

image

Getting started with Spark Debugging and Diagnosis Toolset

These features have been built into the HDInsight Spark history server.

  • Access from the Azure portal. Open the Spark cluster, click Cluster Dashboard from Quick Links, and then click Spark History Server.
  • Access by URL, open the Spark History Server.

Feedback

We look forward to your comments and feedback. If you have any feature requests, asks, or suggestions, please send us a note at hdivstool@microsoft.com. For bug submissions, please open a new ticket using the template.

For more information, check out the following:

Using AzureAD identities in Azure DevOps organizations backed by Microsoft Accounts

$
0
0
Azure DevOps now supports AzureAD (AAD) users accessing organizations that are backed by Microsoft accounts (MSA). For administrators, this means that if your organization uses MSAs for corporate users, new employees can use their AAD credentials for access instead of creating a new MSA identity. Using this feature doesn’t require any special configuration.  Just like... Read More

What to expect in Spark + AI summit Europe

$
0
0

The Spark + AI summit Europe kicks-off in just a few days in London. Microsoft and many of their customers using Azure Databricks are present during the Summit. Azure Databricks is a first party service on Azure, allowing customers to accelerate big data analytics and artificial intelligence (AI) solutions with a fast, easy, and collaborative Apache SparkTM–based analytics service. Having such a platform improves developer productivity with a single, consistent set of APIs and developers can mix and match different kinds of processing within the same environment. Azure Databricks also improves performance by eliminating unnecessary movement of data across environments.

Here are a few recommended sessions you might find interesting, where customers and partners share success stories leveraging Azure Databricks:

For Oil & Gas

  • Moving Towards AI: Learn from an actual customer how they are leveraging deep learning with Azure Databricks to implement a solution that enables them to detect safety incidents at their gas stations. Also learn how they were able to build an Advanced Analytics COE to lead AI projects across the organization.

For Retail

For Manufacturing

  • Road to Enterprise Architecture for Big Data Applications: Mixing Apache Spark with Singletons, Wrapping, and Façade: Learn from a manufacture of high end automotive parts how they are incorporating big data and advanced analytics worldwide. In the Manufacturing industry, reliability and time to market are key factors to accomplish business goals. Nowadays, analytics are more and more deployed to get insights’ from data and foster a data driven culture to achieve a greater effectiveness and efficiency within business operations. In the analytics domain, real challenges are often represented by data collection, such as the existence of heterogeneous and widespread data sources, the choice of ingestion technologies and strategies, the need to ensure a continuous data inflow, and release production-ready analytics services to be integrated into in daily operations. Learn how the customer is over coming these challenges to adopt AI.
  • Using Apache Spark Structured Streaming on Azure Databricks for Predictive Maintenance of Coordinate Measuring Machines: Learn from a data scientist how he and his team build digital products for their organization. The session will talk about how they use Apache Spark Structured Streaming on the Azure Databricks, to process live data and Spark MLlib to train models for predicting machine failure. This allows users to stay on top of all relevant machine information and to know at a glance if a machine is capable of performing reliably. He will demonstrate how Azure Databricks allows the team to easily schedule and monitor an increasing number of Spark jobs, continuously adding new features to the app.
  • Azure Databricks, Structured Streaming, and Deep Learning Pipelines to Monitor 1,000+ Solar Farms in Real Time: Also in manufacturing, learn from this technical deep dive session about the fundamental architecture, technology, and approach that makes the platform work, beginning with key features of the Azure Databricks cloud and how it works seamlessly with Azure Data Lake and Azure Event Hubs. There will be good coverage of ML and DL Pipelines and how they are used with image recognition and machine learning through Structured Streaming to make real-time decisions, such as:
    • Near-real time processing of image data at frequent intervals to predict cloud cover from onsite cameras
    • Drone Analysis of data and preventative maintenance of fan failures in solar inverters

For Public Sector

  • Fireside Chat: Join this fireside chat to learn from a long time business leader in business intelligence, data and transformation, both here in the UK operating company and abroad. Learn how to define BI and big data strategy and lead on the execution of a major transformation programme to deliver it. Also learn how to be the champion of data at board level, making sure data is treated as the incredible strategic asset that it is.

For Lambda Architecture in the cloud

  • Lambda Architecture in the cloud with Azure Databricks: Another session with a real customer scenario. In this talk the customer demonstrates the blueprint for such an implementation in Microsoft Azure, with Azure Databricks as a key component. You will learn some of the core principles of functional programming link them to the capabilities of Apache Spark for various end-to-end big data analytics scenarios. You will also see “Lambda architecture in use” and the associated trade-offs using a real customer scenario – a terabyte-scale Azure-based data platform that handles data from 2.5M visitors per year.

XKCD “Curve Fitting”, in R

$
0
0

You probably saw this XKCD last week, which brought a grimace of recognition to statisticians everywhere:

Curve_fitting

It's so realistic, that Barry Rowlingson was able to reproduce all but two of the "charts" above with a simple R function (and a little help from the xkcd ggplot2 theme):

And now for @revodavid et al, with the xkcd package and font! (still two more to do...) pic.twitter.com/3aVHis23Gl

— Barry Rowlingson (@geospacedman) September 21, 2018

You can find the R code behind Barry's reproductions here, and I'm sure he'd welcome contributions for the remaining two charts :). 


Why and how you simplify IT with Microsoft 365

$
0
0

During this past week at Microsoft Ignite, it was an honor to spend time sitting with customers, listening to them explain what’s working and what’s not, and learning more about where they need our help.

In my session on Monday, I showed 75 minutes worth of examples of how we’ve applied a new philosophy to the way we build tools and services for IT pros. We refer to this approach to architecture, development, and end-user experience in Microsoft 365 as being “Integrated for Simplicity.” Our goal with this integrated simplicity is to make it as easy as possible for our customers to shift to a modern desktop and make their modern workplace a reality.

As part of my session on Monday, we made a series of announcements that align with this approach:

An infographic announcing new products and capabilities.

The shift to a modern desktop is an extension of what many organizations are already doing or are planning to do in the near future. There are many ways to start this process; for example, many tools and processes you’re using right nowlike ConfigMgr and Active Directorycan easily be cloud-connected. Doing this not only reduces complexityit also harnesses the power of Microsoft’s cloud-driven intelligence.

Modern desktop puts the power of the cloud in the hands of both end users and IT

The makeup of a modern desktop is simple: Windows 10 with Office 365 ProPluswhich are built in and driven by the cloud so that their scale, compute, automation, intelligence, and flexibility can simplify your IT. Supporting your end users with the Office ProPlus apps is a fundamental component of a modern desktop. These are the only apps with an artificial intelligence (AI) that can do the hard work of security while simultaneously improving and beautifying documents and presentations.

An infographic show the modern desktop: Windows 10 plus Office 365.

If you didn’t watch my session live, you can check it out in this recorded media stream. At the end of the session, I share three ways you can start using that cloud intelligence right nowand you can do these three things in minutes, not days.

1. Cloud-connect what you have today

A powerful way to begin cloud-connecting your existing infrastructure is to link your on-premises Active Directory with Azure Active Directory (Azure AD). This process is simple and it adds significant flexibility, security, and mobility to your organization’s identity.

I also strongly encourage you to cloud-connect ConfigMgr with Intune. The process takes #Just4Clicks and, once enabled, reaps immediate rewards including superior visibility into device health, as well as access to actions such as remote wipe and security features like conditional access.

For more information, you can watch the #Just4Clicks video on our Microsoft Cloud channel.

An infographic comparing on-premises versus the modern workplace.

You can also get your files up into the cloud with OneDrive Known Folder Move. This simple process immediately gives you protection from ransomware, and it improves real-time collaboration.

Find more information in our Tech Community blog, Migrate Your Files to OneDrive Easily with Known Folder Move.

2. Gain superior visibility and control

One of the many announcements we made at Ignite was the work we’ve done to merge 20+ separate web consoles into a single point of entry called the Microsoft 365 admin center. This consolidation is a part of our focus on integrated simplicity, and it features seven specialist workspaces for security, compliance, device management, and more.

An infographic showing what's available in the Microsoft 365 admin center.

I encourage you to check out the preview at admin.microsoft.com

Another simple action with big benefits is enabling conditional access so that you can better understand how corporate data is being accessed by personal devices. Configuring conditional access is easy and it dramatically increases your security posture while also reducing the risk of both intentional and accidental data leakage.

Learn more about how to enable conditional access.

In addition to support for Win32 app deployment in Intune, we also announced Intune security baselines. These baselines are pre-configured (but still customizable!) and published every month. I strongly encourage everyone using Intune to enable these as soon as possible.

More information is available in Using security baselines in your organization.

3. Shift to a modern desktop

For years, engineers at Microsoft have dreamed of building a service that learns from the millions of devices, billions of authentications, and trillions of signals in the Microsoft Cloudand then applies that information to the estates of our customers in real-time. Desktop Analytics is the realization of that dream.

Desktop Analytics is one of the most powerful tools we have ever createdand it is custom built to give IT teams the insight and information they need to deploy, manage, and service apps and devices.

An infographic about Desktop Analytics.

Desktop Analytics offers a tightly integrated, end-to-end solution that automates the mountain of work required to validate the compliance of your hardware, drivers, applications (both 3rd party and your own internally developed), as well as the Office add-ins. This doesn’t just eliminate hundreds of hours of work for IT teams, it wipes out thousands of hours otherwise spent on manual compliance checks which have chronically stolen your bandwidth at a time when you could be pursuing strategic projects that make a lasting impact on the way your company operates.

Desktop Analytics is currently in private preview (public preview will be announced soon), but you don’t need to wait to use it: The Windows Analytics service (which is part of Desktop Analytics) is available to use right now. I think you’ll be really surprised by how much Windows Analytics will simplify and improve your ability to manage devices and apps, as well as simplify the task of upgrading to Windows 10.

More information is available in Windows Analytics Overview: Device Health, Update Compliance, Upgrade Readiness.

I also want to highlight how simple and valuable it is to shift from Office perpetual to Office 365 ProPlus with the Office Customization Tool in ConfigMgr. This is proof of how easy it now is for your on-premises infrastructure and the cloud to work together to reduce the complexity of what would otherwise be arduous manual taskse.g., migrating from MSI deployments of Office perpetual editions in favor of Office 365 ProPlus Click-to-Run.

Only the Office ProPlus apps offer the AI required for these scenarios.

More information is available in Overview of the Office Customization Tool for Click-To-Run.

As you plan for the future of your organization, prioritize finishing Windows 10 upgrades before January 2020. Both Windows 7 and Office 2010 will reach the end of extended support in 2020, and based on our data, we can see that there are now more devices in the enterprise running Windows 10 than any other previous version of Windows.

If your Windows 10 deployment hasn’t also reached the halfway mark yet, now is a great time to reach out to our FastTrack team for help with upgrades, migrations, and (as of Ignite) application compatibility as part of the newly announced Desktop App Assure program.

An infographic showing the rate of Windows 10 enterprise adoption.

More information is available in Helping customers shift to a modern desktop.

Make the shift today

I started Monday’s session talking about the past instead of the future.

This look backwards focused on the little-known story of John Napier. In the early 1600s, Napier was an eccentric inventor and treasure hunter who never left his home without a wooden box of spiders in his pocket or a black rooster he considered magical. From this very unlikely source came a project 20 years and 10 million calculations in the making.

In 1614, he published a 147-page book that ushered in the technical underpinnings of the modern world. With no advanced notice or fanfare, he introduced the concept of logarithms and how to use them.

Once logarithmic tables were available, the sciences and engineering professions surged. Almost overnight, a world full of equations that could not be solved by hand within the time limits of a normal lifespan could be unraveled in minutes. This made the world a dramatically simpler place, and the sciences surged with this new, user-friendly computational technology.

Logarithmic calculations offered the means for accurate measures of planetary orbits, which led to interstellar cartography, which led to satellites and moon landings. Trade routes could now be measured and planned across oceans instead of counties. Engineers could now build things bigger, safer, and strongerwhich led to industrialization, internal combustion, and skyscrapers. In very short order mobility leapt from carts, to steam engines, to intercontinental flight, and human productivity took flight by moving from hand tools, to electricity, to the cloud.

I believe we’re at another pivotal moment in history. All hyperbole aside, I see the volume and quality of the new tools demonstrated at Ignite as a huge opportunity for IT. Not only do these tools work with and expand upon the elements you already have within your infrastructure, but they put the power of the cloud in the hands of every one of your end users. The integrated simplicity and functionality of what has been built for IT pros allows you to cloud-connect the work you are doing and use cloud-based intelligence to transform your organization.

Please evaluate and investigate all of our announcementsand don’t hesitate to share your feedback. I appreciate your partnership and I am grateful for the incredible work you do every day.

The post Why and how you simplify IT with Microsoft 365 appeared first on Microsoft 365 Blog.

Exploring .NET Core’s SourceLink – Stepping into the Source Code of NuGet packages you don’t own

$
0
0

According to https://github.com/dotnet/sourcelink, SourceLink "enables a great source debugging experience for your users, by adding source control metadata to your built assets."

Sound fantastic. I download a NuGet to use something like Json.NET or whatever all the time, I'd love to be able to "Step Into" the source even if I don't have laying around. Per the GitHub, it's both language and source control agnostic. I read that to mean "not just C# and not just GitHub."

Visual Studio 15.3+ supports reading SourceLink information from symbols while debugging. It downloads and displays the appropriate commit-specific source for users, such as from raw.githubusercontent, enabling breakpoints and all other sources debugging experience on arbitrary NuGet dependencies. Visual Studio 15.7+ supports downloading source files from private GitHub and Azure DevOps (former VSTS) repositories that require authentication.

Looks like Cameron Taggart did the original implementation and then the .NET team worked with Cameron and the .NET Foundation to make the current version. Also cool.

Download Source and Continue Debugging

Let me see if this really works and how easy (or not) it is.

I'm going to make a little library using the 5 year old Pseudointernationalizer from here. Fortunately the main function is pretty pure and drops into a .NET Standard library neatly.

I'll put this on GitHub, so I will include "PublishRepositoryUrl" and "EmbedUntrackedSources" as well as including the PDBs. So far my CSPROJ looks like this:

<Project Sdk="Microsoft.NET.Sdk">

<PropertyGroup>
<TargetFramework>netstandard2.0</TargetFramework>
<PublishRepositoryUrl>true</PublishRepositoryUrl>
<EmbedUntrackedSources>true</EmbedUntrackedSources>
<AllowedOutputExtensionsInPackageBuildOutputFolder>$(AllowedOutputExtensionsInPackageBuildOutputFolder);.pdb</AllowedOutputExtensionsInPackageBuildOutputFolder>
</PropertyGroup>
</Project>

Pretty straightforward so far. As I am using GitHub I added this reference, but if I was using GitLab or BitBucket, etc, I would use that specific provider per the docs.

<ItemGroup>

<PackageReference Include="Microsoft.SourceLink.GitHub" Version="1.0.0-beta-63127-02" PrivateAssets="All"/>
</ItemGroup>

Now I'll pack up my project as a NuGet package.

D:githubSourceLinkTestPsuedoizerCore [master ≡]> dotnet pack -c release

Microsoft (R) Build Engine version 15.8.166+gd4e8d81a88 for .NET Core
Copyright (C) Microsoft Corporation. All rights reserved.

Restoring packages for D:githubSourceLinkTestPsuedoizerCorePsuedoizerCore.csproj...
Generating MSBuild file D:githubSourceLinkTestPsuedoizerCoreobjPsuedoizerCore.csproj.nuget.g.props.
Restore completed in 96.7 ms for D:githubSourceLinkTestPsuedoizerCorePsuedoizerCore.csproj.
PsuedoizerCore -> D:githubSourceLinkTestPsuedoizerCorebinreleasenetstandard2.0PsuedoizerCore.dll
Successfully created package 'D:githubSourceLinkTestPsuedoizerCorebinreleasePsuedoizerCore.1.0.0.nupkg'.

Let's look inside the .nupkg as they are just ZIP files. Ah, check out the generated *.nuspec file that's inside!

<?xml version="1.0" encoding="utf-8"?>

<package xmlns="http://schemas.microsoft.com/packaging/2012/06/nuspec.xsd">
<metadata>
<id>PsuedoizerCore</id>
<version>1.0.0</version>
<authors>PsuedoizerCore</authors>
<owners>PsuedoizerCore</owners>
<requireLicenseAcceptance>false</requireLicenseAcceptance>
<description>Package Description</description>
<repository type="git" url="https://github.com/shanselman/PsuedoizerCore.git" commit="35024ca864cf306251a102fbca154b483b58a771" />
<dependencies>
<group targetFramework=".NETStandard2.0" />
</dependencies>
</metadata>
</package>

See under repository it points back to the location AND commit hash for this binary! That means I can give it to you or a coworker and they'd be able to get to the source. But what's the consumption experience like? I'll go over and start a new Console app that CONSUMES my NuGet library package. To make totally sure that I don't accidentally pick up the source from my machine I'm going to delete the entire folder. This source code no longer exists on this machine.

I'm using a "local" NuGet Feed. In fact, it's just a folder. Check it out:

D:githubSourceLinkTestAConsumerConsole> dotnet add package PsuedoizerCore -s "c:usersscottdesktopLocalNuGetFeed"

Writing C:UsersscottAppDataLocalTemptmpBECA.tmp
info : Adding PackageReference for package 'PsuedoizerCore' into project 'D:githubSourceLinkTestAConsumerConsoleAConsumerConsole.csproj'.
log : Restoring packages for D:githubSourceLinkTestAConsumerConsoleAConsumerConsole.csproj...
info : GET https://api.nuget.org/v3-flatcontainer/psuedoizercore/index.json
info : NotFound https://api.nuget.org/v3-flatcontainer/psuedoizercore/index.json 465ms
log : Installing PsuedoizerCore 1.0.0.
info : Package 'PsuedoizerCore' is compatible with all the specified frameworks in project 'D:githubSourceLinkTestAConsumerConsoleAConsumerConsole.csproj'.
info : PackageReference for package 'PsuedoizerCore' version '1.0.0' added to file 'D:githubSourceLinkTestAConsumerConsoleAConsumerConsole.csproj'.

See how I used -s to point to an alternate source? I could also configure my NuGet feeds, be they local directories or internal servers with "dotnet new nugetconfig" and including my NuGet Servers in the order I want them searched.

Here is my little app:

using System;

using Utils;

namespace AConsumerConsole
{
class Program
{
static void Main(string[] args)
{
Console.WriteLine(Pseudoizer.ConvertToFakeInternationalized("Hello World!"));
}
}
}

And the output is [Ħęľľő Ŵőřľđ! !!! !!!].

But can I step into it? I don't have the source remember...I'm using SourceLink.

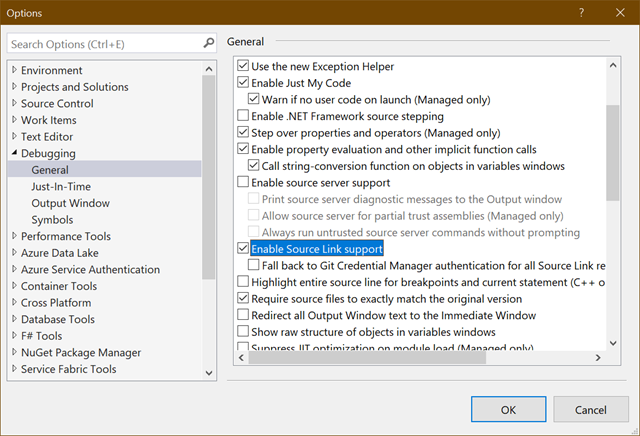
In Visual Studio 2017 I confirm that SourceLink is enabled. This is the Portable PDB version of SourceLink, not the "SourceLink 1.0" that was "Enable Source Server Support." That only worked on Windows..

Enable Source Link Support

You'll also want to turn off "Just My Code" since, well, this isn't your code.

Disable Just My Code

Now I'll start a Debug Session in my consumer app and hit F11 to Step Into the Library whose source I do not have!

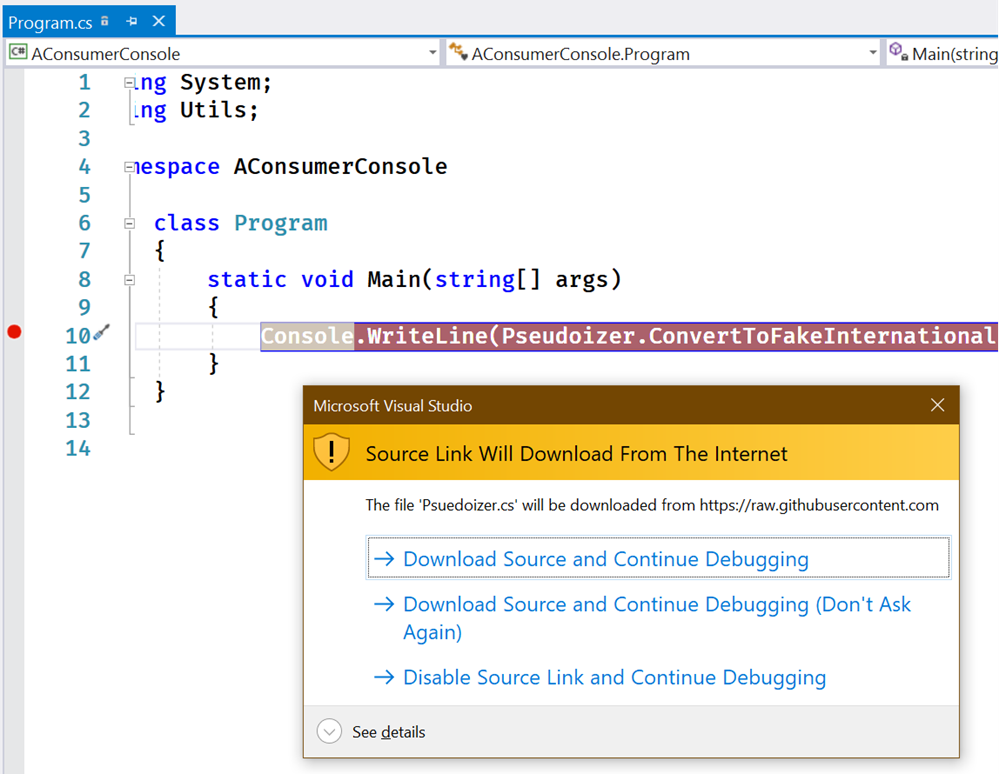
Source Link Will Download from The Internet

Fantastic. It's going to get the source for me! Without git cloning the repository it will seamlessly let me continue my debugging session.

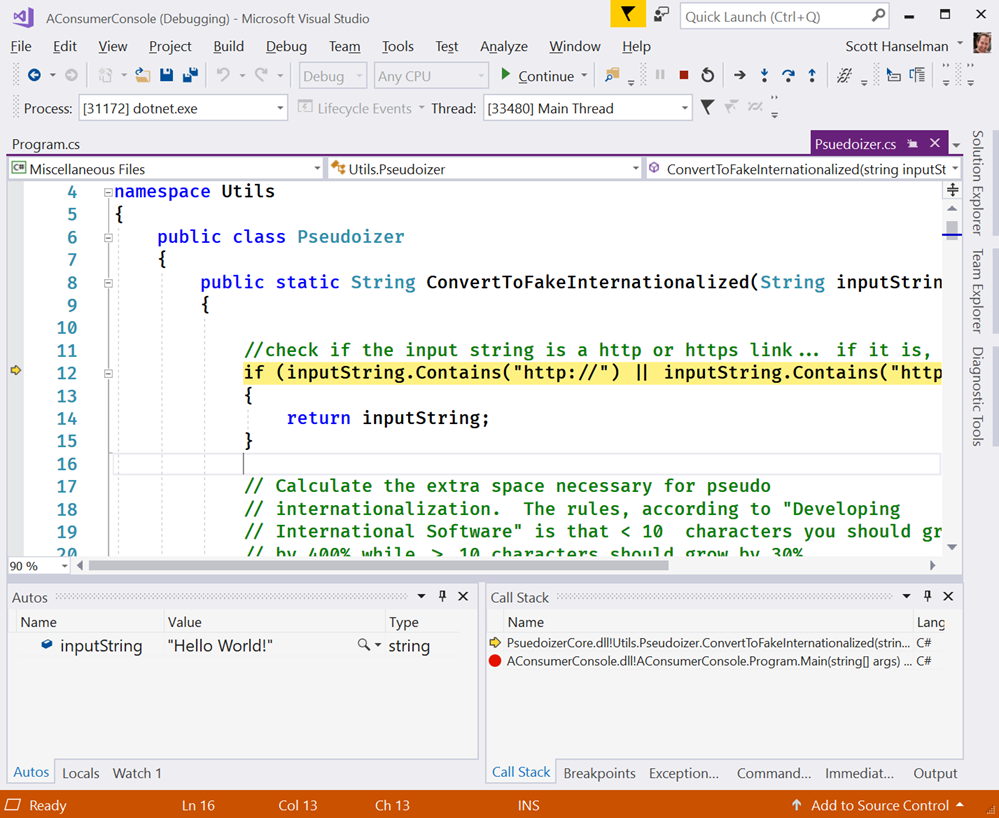
The temporary file ended up in C:UsersscottAppDataLocalSourceServer4bbf4c0dc8560e42e656aa2150024c8e60b7f9b91b3823b7244d47931640a9b9 if you're interested. I'm able to just keep debugging as if I had the source...because I do! It came from the linked source.

Debugging into a NuGet that I don't have the source for

Very cool. I'm going to keep digging into SourceLink and learning about it. It seems that if YOU have a library or published NuGet either inside your company OR out in the open source world that you absolutely should be using SourceLink.

You can even install the sourcelink global tool and test your .pdb files for greater insight.

D:githubSourceLinkTestPsuedoizerCore>dotnet tool install --global sourcelink

D:githubSourceLinkTestPsuedoizerCorebinreleasenetstandard2.0>sourcelink print-urls PsuedoizerCore.pdb
43c83e7173f316e96db2d8345a3f963527269651 sha1 csharp D:githubSourceLinkTestPsuedoizerCorePsuedoizer.cs
https://raw.githubusercontent.com/shanselman/PsuedoizerCore/02c09baa8bfdee3b6cdf4be89bd98c8157b0bc08/Psuedoizer.cs
bfafbaee93e85cd2e5e864bff949f60044313638 sha1 csharp C:UsersscottAppDataLocalTemp.NETStandard,Version=v2.0.AssemblyAttributes.cs
embedded

Think about how much easier consumers of your library will have it when debugging their apps! Your package is no longer a black box. Go set this up on your projects today.


Sponsor: Rider 2018.2 is here! Publishing to IIS, Docker support in the debugger, built-in spell checking, MacBook Touch Bar support, full C# 7.3 support, advanced Unity support, and more.


© 2018 Scott Hanselman. All rights reserved.
     

Advanced Threat Protection for Azure Storage now in public preview

$
0
0

We are excited to announce that this week we have made Advanced Threat Protection available for public preview on Azure Storage Blob service. Advanced Threat Protection for Azure Storage detects anomalous activities indicating unusual and potentially harmful attempts to access or exploit storage accounts.

The introduction of this feature helps customers detect and respond to potential threats on their storage account as they occur. For a full investigation experience, it is recommended to configure diagnostic logs for read, write, and delete requests for the blob services.

The benefits of Advanced Threat Protection for Azure Storage include:

  • Detection of anomalous access and data exfiltration activities.
  • Email alerts with actionable investigation and remediation steps.
  • Centralized views of alerts for the entire Azure tenant using Azure Security Center.
  • Easy enablement from Azure portal.

How to set up Advanced Threat Protection

  • Launch the Azure portal.
  • Navigate to the configuration page of the Azure Storage account you want to protect. In the Settings page, select Advanced Threat Protection.
  • In the Advanced Threat Protection configuration blade:
    • Turn on Advanced Threat Protection.
    • Click Save to save the new or updated Advanced Threat Protection policy.

image

Get started today

We encourage you to try out Advanced Threat Protection for Azure Storage and start detecting potential threats to your storage account. Learn more about Advanced Threat Protection for Azure Storage on our getting started page.

Try it out and let us know what you think in the comments.

HDInsight Enterprise Security Package now generally available

$
0
0

Enterprise Security Package GA for HDInsight 3.6

The HDInsight team is excited to announce the general availability of Enterprise Security Package (ESP) for Apache Spark, Apache Hadoop and Interactive Query clusters in HDInsight 3.6. When enterprise customers share clusters between multiple employees, Hadoop admins must ensure those employees have the right set of accesses and permissions to perform big data operations. In enterprises, multi-user access with granular authorization using the same identities in the enterprise is a complex and lengthy process. Enabling ESP with the new experience provides authentication and authorization for these clusters in a more streamlined and secure manner.

For authentication, open source Apache Hadoop relies on Kerberos. Customers can enable Azure AD Domain Services (AAD-DS) as the main domain controller and use that for domain joining of the clusters. The same identities available in AAD-DS will then be able to login to the cluster.

For authorization, customers can set Apache Ranger policies to get fine-grained authorization in their clusters. Apache Hive and Yarn Ranger plugins are available for setting these policies.

To learn more about ESP and how to enable it, see our documentation.

Public preview of ESP for Apache Kafka and HBase

We are also expanding ESP to HDInsight 3.6 Apache Kafka and Apache HBase clusters. Apache Kafka and HBase customers can now use domain accounts and Apache Ranger for Authentication and Authorization. Enabling ESP means Apache Kafka and HBase Ranger plugins will be available out of the box. To learn more about secure Kafka clusters, see our documentation.

Managed Identity support in HDInsight

With the most recent set of security enhancements in HDInsight, we are now excited to announce that user-assigned managed identity is now supported in HDInsight.  Previously customers had to provide a service account with a password to enable ESP. This process is now simplified with managed identity. Customers now create and provide a managed identity at the cluster creation time without entering any password. Today, there are two main scenarios that rely on managed identity:

  1. As a pre-requisite for enabling ESP, users should enable AAD-DS, then create a managed identity and give it the correct permission in AAD-DS Access control (IAM) blade. This will ensure that the managed identity will have access to perform domain operations seamlessly without providing any additional password. Users will then use this identity to create a secure HDInsight cluster. For more information on how to configure this, see our documentation.
  2. For Apache Kafka clusters, customers can now authorize the managed identity to have proper access to an encryption key stored in Azure Key vault to perform disk encryption at rest. This scenario is also known as BYOK (Bring Your Own Key). For more information, see our documentation.

New UX to create ESP clusters

As part of the improvements for GA, we have created a brand new user experience in Azure portal for enabling ESP. This new experience will automatically detect and validate common misconfigurations related to AAD-DS. This will help save a lot of time and fix errors upfront before the user hits the create button. To learn more about the new configuration steps, see our documentation.

Try Azure HDInsight now

We are excited to see what you will build next with Azure HDInsight. Read this developer guide and follow the quick start guide to learn more about implementing open source analytics pipelines on Azure HDInsight. Stay up-to-date on the latest Azure HDInsight news and features by following us on Twitter #HDInsight and @AzureHDInsight. For questions and feedback, please reach out to AskHDInsight@microsoft.com.

About HDInsight

Azure HDInsight is an easy, cost-effective, enterprise-grade service for open source analytics that enables customers to easily run popular open source frameworks including Apache Hadoop, Spark, Kafka, and others. The service is available in 27 public regions and Azure Government Clouds in the US and Germany. Azure HDInsight powers mission critical applications in a wide variety of sectors and enables a wide range of use cases including ETL, streaming, and interactive querying.

Healthcare costs are skyrocketing! Reduce costs and optimize with AI

$
0
0

In 2016, healthcare costs in the US are estimated at nearly 18 percent of the GDP! Cost reduction is a high priority for all types of healthcare organizations, but especially healthcare providers such as hospitals, clinics, and many others. Optimizing operations within healthcare providers offers substantial benefits in both efficiency and cost reduction. In this use case, healthcare providers seek to optimize resource and asset allocation over time. This can include the allocation of medical devices, staffing of healthcare professionals, and other key aspects of operations. Efficient and affordable healthcare can help significantly improve the experience of patients, healthcare professionals, and even improve the quality of care and patient outcomes. Especially in emergency situations where the lack of healthcare resources or asset allocation could impact patient care. For healthcare professionals under time and cost reduction pressure, and increasingly at risk of clinician burnout, efficient operations and improved experience can be a significant morale booster.

Below I highlight three strategies to optimize healthcare using artificial intelligence.

image

Optimize your healthcare operations using AI

Artificial intelligence (AI) and machine learning (ML) have great potential to help healthcare providers identify opportunities to optimize their operations and realize cost savings. For example, AI could be used to predict a patient’s length of stay. The ability to accurately predict a patient’s length of stay can streamline operations by ensuring that the hospital has adequate, but not excessive staffing, and asset allocation for the duration of the patient stay.

In this solution, historical data is used to train ML models that can then be used to predict future length of stay. This historical data can include patient conditions such as asthma, pneumonia, malnutrition, etc. It can also include patient vital measurements such as blood pressure, pulse, and respiration. Lastly, each record includes the actual patient length of stay. Generally, the more training data the better the quality of inference and the lower the error margins. Also ensuring high quality training data will improve inference results. Conversely, training data that is biased can affect the ML model and cause wider error margins. For example, measurements from a faulty sensor such as a faulty blood pressure cuff can be biased, and training AI models with such data can lead to AI models that are also biased. Typically to ensure a reasonable quality of inference requires at least 100,000 records or a smaller number of high-quality records.

Deploy AI in the cloud to further reduce costs, improve agility, and scalability

Maintaining IT data center computing equipment in a hospital or other healthcare provider facilities requires substantial capital, as well as expensive IT and cybersecurity resources to maintain and secure it. That capital could be allocated more directly to improving patient care. For example, investing in new kidney dialysis machines. In contrast deploying to the cloud avoids much of the expense of data center equipment, and substantially reduces the requirements for IT and cybersecurity resources. Current IT resources can then devote more time to other activities related to AI or ML. Cloud based deployments are also much more agile and scalable, able to rapidly adapt to changing healthcare requirements and grow as needed.

Accelerate your AI cloud initiative with blueprints

As the saying goes, the future is already here, it’s just not evenly distributed. AI is a transformational technology and a big part of the future. The key is to get started. You could start your healthcare optimization from scratch with an AI initiative. Or you could accelerate your initiative using Microsoft healthcare AI blueprints. These blueprints include example code, test data, automated deployment, and much more that enable you to rapidly establish an initial working reference deployment that you can study and then customize to meet your requirements. A blueprint can get you 50-90 percent closer towards your end solution, versus starting from zero. The health data and AI blueprint is an example of such a blueprint. It is also focused on the patient length of stay prediction use case discussed above.

Download the blueprint now for free. Configure it, then deploy it to your Azure cloud, and get a head start in optimizing your healthcare organization.

Collaboration

What other opportunities are you seeing to optimize healthcare and reduce costs with AI? We welcome any feedback or questions you may have below in the comments. AI in healthcare is a fast-moving field. New developments are emerging daily. Many of these new developments are not things you can read about yet in a textbook. I post daily about these new developments and solutions in healthcare, AI, cloud computing, security, privacy, and compliance on social media. Reach out to connect with me on LinkedIn and Twitter.

Next steps

Protecting banks through cloud-based sanction screening solutions

$
0
0

At a previous position, I owned the software and hardware testing across a 6,000-branch network for a large fortune 100 bank in the U.S. The complexity and sophistication of the end-to-end delivery of products and services to existing customers was daunting. Vetting new, potential customers while simultaneously building a new system was tough. Especially since the new system had to balance a pleasant front-end user experience with the backend processes from strong Know Your Customer (KYC) scrubbing (in other words, due diligence). That backend system was invisible, batch-based, and only had post-transaction look back capability. I learned that banks can have their cake and eat it too, but the business implications of limiting user friction are not trivial, and properly vetting customers puts a lot of pressure on the technology capabilities.

image

As a compliment to my online and mobile fraud theme this quarter see Detecting Online and Mobile Fraud with AI, I’ll provide some insights on how banks are seeking to rationalize and simplify security and compliance processes in real-time. The path stretches from the device to the network and back-end infrastructure. The goal is to ease the burden on employees and reduce costs from fines. Specifically, the requirements to screen customers and transactions against a variety of sanctions lists places a burden on banks. The remedy is “sanction screening.” That means vetting customer databases, payments, and other transactions for individuals or organizations that are on government-managed sanctions lists.

Banks should seriously consider cloud-based technology screening solutions that provide these features:

  • Industry-leading protection that screens against multiple watch lists
  • Intelligent, adaptive lexical screening that enhances security
  • The lowest rate of false positive alerts in the industry
  • Precise, real-time screening that is simple to use
  • Intuitive alert management tools to streamline operations
  • Accessible insights with graphical dashboards showing risk levels
  • Seamless integration with multiple business systems
  • Open technology and flexible configuration options
  • Broad cloud compliance that meets a range of international and national standards (Azure meets more than any other cloud)
  • Best-in-class cloud protection that embeds security and privacy in every step

As you consider moving to real-time sanction screening, look for detection and decision engines that are precise, fast, easy to configure, and simple to use. The technology should include features that continually evolve and adapt to new classes of items to screen — ensuring banks prevent terror and criminal financing with best-in-class tools. The solution must demonstrate the ability to achieve low rates of false positives alerts with accurate algorithms. Lower rates mean lower costs from redundant validation.

From an operational perspective, the solution needs to have flexible configuration options enabling agile, cost-effective implementations. If the solution has thoughtful, ‘out-of-the-box’ defaults for customer and transaction screening, it’s a bonus. Focus on these areas: Information Collection, Monitoring, Alert Investigation, Case Management and Reporting, Policy Definition and Implementation, and IT Support for Sanctions.

Client onboarding is a critical area to have efficient sanction competencies, but unfortunately, many banks are still collecting KYC information and documents from the customer in-branch web/mainframe systems and/or good old paper forms. Digital transformation demands sanction functionality at the online banking and mobile banking tiers and needs to include the broader view of how prospects and customers matriculate across the disparate banking systems.

As the volume of electronic payments continues to rise in line with new digital channels, so does financial crime. Financial institutions have the burden of: (1) keeping up to date with embargoed countries, (2) evolving sanctions regulations, and (3) complying with frequently updated lists and procedures. Regulators are cracking down harder, and record-breaking fines are levied more frequently. Without the right software to adapt to the multitude of changing lists and rules, these fines (and worse), will continue.

Want to know about other areas of financial crime, like online and mobile fraud? First read Detecting Online and Mobile Fraud with AI Use Case providing actionable recommendations and solutions, then engage with the author on this topic by reaching out to me on Twitter and Linkedin.

Gaining insights from industrial IoT data with Microsoft Azure

$
0
0

Technology is moving at an amazing pace. Manufacturers around the world are observing this first-hand. Additive manufacturing, robotics, and IoT are some of the technologies that directly influence the way manufacturing businesses operate. The manufacturing industry is not isolated from the huge leaps in computer technology. Software packages used for managing complex processes and fabrication machine tools (for example, Computer numerical control milling and CNC turning) are everywhere and are generating huge amounts of data.

I have heard from many customers in the manufacturing industry that they are not sure what steps they need to take to gain insights from all the data they have.

image

My recommendation is to start small. Do not make big investments right at the start, but first discover what can be gained from the available choices. Then bring it into a platform that can provide many other possibilities, such as machine learning and AI. The Azure platform features many application services. But important to manufacturers, Azure gives access to hardware resources, such as faster CPUs, field programmable gate arrays (FPGA), and graphics processing units (GPU) — all are easily accessible for state-of-the-art solutions.

What is starting small? What is possible? While seeking answers to those questions, I came across the US National Institute of Standards and Technology (NIST) Smart Manufacturing Systems (SMS) Test Bed. The test bed exposes data from a manufacturing lab. It is a great real-life example. The manufacturing lab actively collects and publishes data on the internet. Using the SMS Test Bed data as an example, I decided to put together an article to demonstrate how to put together a solution to gain insights from existing IoT data.

Read the guide and get started today

The result of my research is a solution guide. It starts with the data source, then describes how the data can be ingested and analyzed to gain insights. The guide covers various architectural aspects of this scenario and demonstrates the decision-making process for choosing the suitable technologies from the Azure platform, based on the requirements of the scenario. If you want to read and find out the details yourself, download the Extracting actionable insights from IoT data solution guide.

Viewing all 10804 articles
Browse latest View live


<script src="https://jsc.adskeeper.com/r/s/rssing.com.1596347.js" async> </script>