Today we are excited to announce that Azure DevOps is now available over Azure ExpressRoute. Customers who typically operate in the government and financial services sectors have requested this support because they want private connections that don’t go over the public Internet for security reasons. ExpressRoute also typically offers them more reliability, faster speeds, and... Read More
↧
ExpressRoute for Azure DevOps
↧
Call For Participation: .NET and TypeScript at FOSDEM conference
The organizers of the FOSDEM 2019 conference have allocated a “Developer Room” on Saturday February 2nd 2019 for .NET and TypeScript discussions in Brussels Belgium. FOSDEM is one of Europe’s most exciting free software conferences that runs over a weekend and gathers many open source communities, contributors and activists in one place to learn about the state of the world.
We are looking for:
- Keynote presenters, with bold and vibrant ideas to share with the community at large
- Technical presentations (30 minutes, including questions and discussions) related to .NET, C#, F#, TypeScript
- Presentations about the use of .NET or TypeScript for commercial, academic, hobbyists and other projects
- Tutorials
- Lightning talks (5 minutes each)
This is a partial list of ideas that might be of interest to the audience, it is by no means comprehensive, so if your project or ideas is not included, feel free to submit a proposal anyways:
- Innovative ideas, fresh new takes on old problems for server applications, client applications.
- Interoperability with other ecosystems
- Best practices, code quality, testing,
- Building software for users
- Compilers, Runtimes, Libraries
- IDEs
- Tips and Tricks
Submission
To submit a talk proposal, please include:
- Title
- Abstract (at least two paragraphs)
- Describe what your project or presentation is about.
- What the audience will learn from the talk.
- How can people help out with the project, what feedback are you looking for?
- Recording me on audio and/or video
- acceptable under a CC-BY-2.0 license (DEFAULT)
- not acceptable
- Brief Bio
- Microblog URL
- Blog URL
To submit your proposal, please create an account on the FOSDEM site at https://penta.fosdem.org/user/new_account and submit your proposal at https://penta.fosdem.org/submission/FOSDEM19 and make sure you flag it as being part of the .NET and TypeScript developer room.
Deadline
The The deadline for receiving submissions is December 3rd, 2018. Speakers will be notified of acceptance or rejection by the 18th of December.
↧
↧
.NET Core Source Code Analysis with Intel® VTune™ Amplifier
This post was written by Varun Venkatesan, Li Tian, Denis Pravdin, who are engineers at Intel. They are excited to share .NET Core-specific enhancements that Intel has made to VTune Amplifier 2019. You can use this tool to use to make .NET Core applications faster on Intel processors.
Last year in the .NET blog, we discussed .NET Core Performance Profiling with Intel® VTune Amplifier 2018 including profiling Just-In-Time (JIT) compiled .NET Core code on Microsoft Windows* and Linux* operating systems. This year Intel VTune Amplifier 2019 was launched on September 12th, 2018 with improved source code analysis for .NET Core applications. It includes .NET Core support for profiling a remote Linux target and analyzing the results on a Windows host. We will walk you through a few scenarios to see how these new VTune Amplifier features can be used to optimize .NET Core applications.
Note that VTune Amplifier is a commercial product. In some cases, you may be eligible to obtain a free copy of VTune Amplifier under specific terms. To see if you qualify, please refer to https://software.intel.com/en-us/qualify-for-free-software and choose download options at https://software.intel.com/en-us/vtune/choose-download.
Background
Before this release, source code analysis on VTune Amplifier hotspots for JIT compiled .NET Core code was not supported on Linux and limited support on Windows. Hotspot functions were only available at the assembly-level and not at source-level, as shown in the figure below.

VTune Amplifier 2019 addresses this issue and provides full source code analysis for JIT compiled code on both Windows and Linux. It also supports remote profiling a Linux target from a Windows host. Let’s see how these features work using sample .NET Core applications on local Linux host, local Windows host and remote Linux profiling with Windows host analysis.
Here is the hardware/software configuration for the test system:
- Processor: Intel(R) Core(TM) i7-5960X CPU @ 3.00GHz
- Memory: 32 GB
- Ubuntu* 16.04 LTS (64-bit)
- Microsoft Windows 10 Pro Version 1803 (64-bit)
- .NET Core SDK 2.1.401
Profiling .NET Core applications on a local Linux host
Let’s create a sample .NET Core application on Linux that multiplies two matrices using the code available here. Following is the C# source code snippet of interest:

Now let’s refer to the instructions from our earlier .NET blog to build and run this application using the .NET Core command-line interface (CLI). Next let’s use VTune Amplifier to profile this application using the Launch Application target type and the Hardware Event-Based Sampling mode as detailed in the following picture.

Here are the hotspots under the Process/Module/Function/Thread/Call Stack grouping:

Now let’s take a look at the source-level hotspots for the Program::Multiply function, which is a major contributor to overall CPU time.

The above figure shows that most of the time is being spent in line 62 which performs matrix arithmetic operations. This source-assembly mapping helps both .NET Core application and compiler developers to identify their source-level hotspots and determine optimization opportunities.
Now, let’s use the new source code analysis feature to examine the assembly snippets corresponding to the highlighted source line.

From the above profile, it is clear that reducing the time spent in matrix arithmetic operations would help lower overall application time. One of the possible optimizations here would be to replace the rectangular array data structure used to represent individual matrices with jagged arrays. The C# source code snippet below shows how to do this (complete code is available here).

Here is the updated list of hotspot functions from VTune Amplifier:

We can see that the overall application time has reduced by about 21%1 (from 16.660 s to 13.175 s).
The following figure shows the source-assembly mapping for the Program::Multiply function. We see that there is a corresponding reduction in CPU time for the highlighted source line which performs matrix arithmetic operations. Note that the size of the JIT generated code has been reduced too.

This is a brief description about the feature on Linux. Similar analysis with the matrix multiplication samples above could be done on Windows and we leave that as an exercise for you to try. Now, let’s use a different example to see how source code analysis works on Windows.
Profiling .NET Core applications on a local Windows host
Let’s create a sample .NET Core application on Windows that reverses an integer array using the code available here. Following is the C# source code snippet of interest:

Now let’s refer to the instructions from our earlier .NET blog to build and run this application using the .NET Core command-line interface (CLI). Next let’s use VTune Amplifier to profile this application using the Launch Application target type and the Hardware Event-Based Sampling mode as detailed in the following picture. Additionally, we need to provide the source file location on Windows using the Search Sources/Binaries button before profiling.

Here are the hotspots under the Process/Module/Function/Thread/Call Stack grouping:

Now let’s take a look at the source-level hotspots for the Program::IterativeReverse function, which is a major contributor to overall CPU time.

The above figure shows that most of the time is being spent in line 48 which performs array element re-assignment. Now, let’s use the new source code analysis feature to examine the assembly snippets corresponding to the highlighted source line.

One of the possible optimizations here would be to reverse the integer array by using recursion, rather than iterating over the array contents. The C# source code snippet below shows how to do this (complete code is available here).

Here is the updated list of hotspot functions from VTune Amplifier:

We can see that the overall application time has reduced by about 42%2 (from 13.095 s to 7.600 s).
The following figure shows the source-assembly mapping for the Program::RecursiveReverse function.

As we can see, the reduction in time is reflected in the source lines above, giving developers a clear picture on how their application performs.
Profiling .NET Core applications on a remote Linux target and analyzing the results on a Windows host
Sometimes .NET Core developers may need to collect performance data on remote target systems and later finalize the data on a different machine in order to work around resource constraints on the target system or to reduce overhead when finalizing the collected data. VTune Amplifier 2019 has added .NET Core support to collect profiling data from a remote Linux target system and analyze the results on a Windows host system. This section illustrates how to leverage this capability using the matrix multiplication .NET Core application discussed earlier (source code is available here).
First let’s publish the sample application for an x64 target type on either the host or the target with: dotnet publish –c Release –r linux-x64. Then we need to copy the entire folder with sources and binaries to the other machine. Next let’s setup a password-less SSH access to the target with PuTTY, using instructions here. We also need to set /proc/sys/kernel/perf_event_paranoid and /proc/sys/kernel/kptr_restrict to 0 in the target system to enable driverless profiling so that user does not need to install target packages, while VTune Amplifier automatically installs the appropriate collectors on the target system.
echo 0 | sudo tee /proc/sys/kernel/perf_event_paranoid
echo 0 | sudo tee /proc/sys/kernel/kptr_restrict
Now let’s use VTune Amplifier on the host machine to start remote profiling the application run on the target. First we need to set the profiling target to Remote Linux (SSH) and provide the necessary details to establish an SSH connection with the target. VTune Amplifier automatically installs the appropriate collectors on the target system in the /tmp/vtune_amplifier_<version>.<package_num> directory.

Then let’s select the Launch Application target type and the Hardware Event-Based Sampling modes. Additionally, we need to provide the binary and source file locations on Windows using the Search Sources/Binaries button before profiling.

Here are the hotspots under the Process/Module/Function/Thread/Call Stack grouping:

Let’s look at source code analysis in action by selecting one of the hotspot functions.

The support for remote profiling would enable developers collect low-overhead profiling data on resource-constrained target platforms and then analyze this information on the host.
Summary
The Source Code Analysis feature can be a useful value addition to the .NET Core community, especially for developers interested in performance optimization as they can get insights into hotspots at the source code and assembly levels and then work on targeted optimizations. We continue to look for additional .NET Core scenarios that could benefit from feature enhancements of VTune Amplifier. Let us know in the comments below if you have any suggestions in mind.
References
VTune Amplifier Product page: https://software.intel.com/en-us/intel-vtune-amplifier-xe
For more details on using the VTune Amplifier, see the product online help.
For more complete information about compiler optimizations, see our Optimization Notice.
No license (express or implied, by estoppel or otherwise) to any intellectual property rights is granted by this document.
Intel disclaims all express and implied warranties, including without limitation, the implied warranties of merchantability, fitness for a particular purpose, and non-infringement, as well as any warranty arising from course of performance, course of dealing, or usage in trade.
This document contains information on products, services and/or processes in development. All information provided here is subject to change without notice. Contact your Intel representative to obtain the latest forecast, schedule, specifications and roadmaps.
The products and services described may contain defects or errors known as errata which may cause deviations from published specifications. Current characterized errata are available on request.
Copies of documents which have an order number and are referenced in this document may be obtained by calling 1-800-548-4725 or by visiting www.intel.com/design/literature.htm.
Intel, the Intel logo, Intel Core, VTune are trademarks of Intel Corporation in the U.S. and/or other countries.
*Other names and brands may be claimed as the property of others
© Intel Corporation.
↧
IoT device authentication options
Picking the right security for the job is a challenging issue. Obviously, everyone wants maximum security for IoT solutions. But issues such as hardware limitations, cost consciousness, lack of security expertise, and more all play into which security option is ultimately chosen for how your IoT devices connect to the cloud. There are many dimensions of IoT security and in my experience authentication type tends to be the first one customers encounter, though all are important.
In this blog post, I'm going to discuss the authentication types supported by the Azure IoT Hub Device Provisioning Service and Azure IoT Hub. There are other authentication methods out there, but these are the ones we have found to be the most widely used.
Azure IoT published a whitepaper about evaluating your IoT security, and we also offer the Security Program for Azure IoT. This security program helps you find the right security auditor for your situation and who can help you figure out how much security you need for your solution. These companies are experts at evaluating IoT security; if you have any in-depth questions around security, I highly recommend you give them a try. You can also learn about how to select secure hardware in this blog post “Whitepaper: Selecting the right secure hardware for your IoT deployment” or in the accompanying whitepaper.
This blog post is not a replacement for a security audit, and it is not meant as a recommendation for any specific form of security. I want you all to be as secure as possible and cannot in good conscience recommend anything less. Take this blog post as a lay of the land to help you understand at a high level what all is possible, and what you should keep in mind as you embark on your IoT security journey. Remember: when in doubt, find an expert.
X.509 certificates
X.509 certificates are a type of digital identity that is standardized in IETF RFC 5280. If you have the time and inclination, I recommend reading the RFC to learn about what makes X.509 certificates useful in IoT scenarios. Learn about installing certs in devices.
There are several ways certificates can be authenticated:
- Thumbprint: A hex string uniquely identifying a cert generated by running a thumbprint algorithm on the cert.
- CA authentication based on a full chain: Ensuring the certificate chain was signed by a trusted signer somewhere in the cert.
Pros
- Most secure key type supported in Azure IoT.
- It allows lots of control around management.
- There are lots of vendor options.
Cons
- Many customers rely on external vendors for certificates.
- Management comes at a price, adding to the overall solution cost.
- Lifecycle management can be a challenge due to the logistical complexities involved.
Trusted Platform Module (TPM)
TPM can refer to a standard for securely storing keys used to authenticate the platform, or it can refer to the I/O interface used to interact with the modules implementing the standard. TPMs can exist as discrete hardware, integrated hardware, firmware-based modules, or software-based modules. Some of the key differences between TPMs and symmetric keys (discussed below) are that:
- TPM chips can also store X.509 certificates.
- TPM attestation in the Device Provisioning Service uses the TPM endorsement key (EK) which is a form of asymmetric authentication, whereas symmetric keys are symmetric authentication.
Pros
- TPMs come standard on many Windows devices, with built-in support in Windows if you're using Windows as your OS.
- TPM attestation is more secure than SAS token-based symmetric key attestation.
- You can also blow away credentials pretty easily, and the Device Provisioning Service auto-rolls the IoT Hub credentials whenever a TPM device comes to re-provision.
Cons
- TPMs are difficult to use in general if you're not familiar with them.
- Difficult to develop for without either a physical TPM or a quality emulator.
- May require board re-design to include in hardware.
- You can't roll the EK without essentially destroying the identity of the chip and giving it a new one. It's like if you had a clone, your clone would have the same physical characteristics as you but they are ultimately a different person. Although the physical chip stays the same, it has a new identity in your IoT solution.
Symmetric key
A symmetric key is known to both the device and the service, and the key is used to both encrypt and decrypt messages sent between parties. Azure IoT supports SAS token-based symmetric key connections. The best way to protect symmetric keys is via a hardware security module.
Pros
- Easiest to get started.
- Nothing extra required to generate.
Cons
- Less secure than X.509 certificates or TPM because the same key is shared between device and cloud, which means the key needs protecting in two places. For certificates, TPM, and PKI in general the challenge is all about proving possession of the key without ever revealing the private portion of the key.
- Easy to have bad security practices. Folks using symmetric keys tend to hardcode the keys in the clear (unencrypted) on devices, leaving the keys vulnerable. It's possible to mitigate some risk by securely storing the symmetric key on the device, but in general, folks using symmetric keys aren't necessarily following best practices around key storage. It's not impossible, just uncommon.
Shared symmetric key
Using the same symmetric key in all your devices. Don't do this ever!
Pros
- Easy to produce at scale.
Cons
- Really, don’t use the same symmetric key in all devices. The risks far outweigh the benefit of easy implementation. It would be security malpractice to suggest that shared symmetric key is a serious solution for IoT authentication.
- Very vulnerable to attack.
- Anyone can impersonate your devices if they get a hold of your key.
- You will likely lose control of devices if you rely on shared symmetric key. Just don’t do it, you can read more on botnets if you’re not convinced that shared symmetric key is a bad idea.
Making the right choice for your devices
You have to evaluate your specific risks and benefits to make your IoT authentication decision. This blog post is too short to cover everything, but Azure IoT offers the Security Program for Azure IoT if you need help making this decision. You can also read our whitepaper about evaluating your IoT security to learn more about your options.
To sum things up with a limerick:
Security means lots of things
As varied as types of machines
Just how much of it
You need for your…stuff
Depends on your specific needs
↧
bingbot Series: Optimizing Crawl Frequency
Last week, we posted the first blog of our bingbot Series: Maximizing Crawl Efficiency highlighting the main goal for bingbot and its core metrics: Crawling Efficiency.
In part 2 of our bingbot series Principal Software Engineering Managing of the crawl team Cheng Lu shares one example of how we’ve optimized our processes to maximize crawl efficiency for large web sites whose content remains static, or unchanging.
When most people conduct a search they typically are looking for the most recent content published; however, the search engine results may link to webpages that were published days ago to years ago. This is a challenge, especially when searchers are wanting to keep up with breaking news and the latest trends by accessing the most up-to-date content online. The internet and search index are full of ghosts of yester-years past, that are often resurrected by the power of search engines. For instance, I was able to retrieve the Microsoft 1996 annual report. Interesting, yes, especially if I need to do a historical report, but if I'm looking for the current annual investment report, it is not so useful. The crawler also needs to have discovered, crawled and indexed the latest Microsoft annual report in order for me to discover it when I do a search.
The challenge for bingbot is that it can't fetch a web page only once. Once a page is published, the search engine must fetch the page regularly to verify that the content has not been updated and that the page is not a dead link. Defining when to fetch the web page next is the hard problem we are looking to optimize with your help.
One challenge that we are trying to address is how often should bingbot crawl a site to fetch the content. The answer depends on the frequency of which the content is edited and updated.
The Cornell University Library empowers Cornell's research and learning community with deep expertise, innovative services, and outstanding collections strengthened by strategic partnerships. Their web site https://arxiv.org/ is a mine of relevant information and it contains millions of web pages on a range of topic from Physics, to Science to Economics. Not only do they have millions of webpages and PDF files related to computer science, they even have content related to crawling and indexing websites.
While new web pages may be posted daily, and some pages are updated on a regular basis, most of the content within the Cornell University Library is not edited for month and even years. The content is by in large static and unedited. By unedited, I mean that the HTML may change a little, for example {copyright 2018} will {become 2019} on January 1st, the CSS and style sheet may change a little; however such changes are not relevant for updating the indexed content within Bing. The content of the page is still the same. Additionally, only few articles are deleted every year. Their library index increases in size with new and updated research, without substantially changing the content of the historically indexed research.
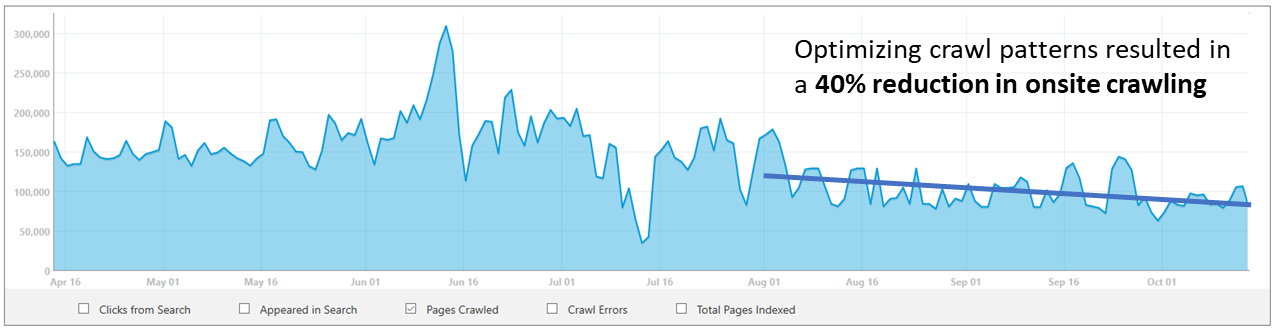
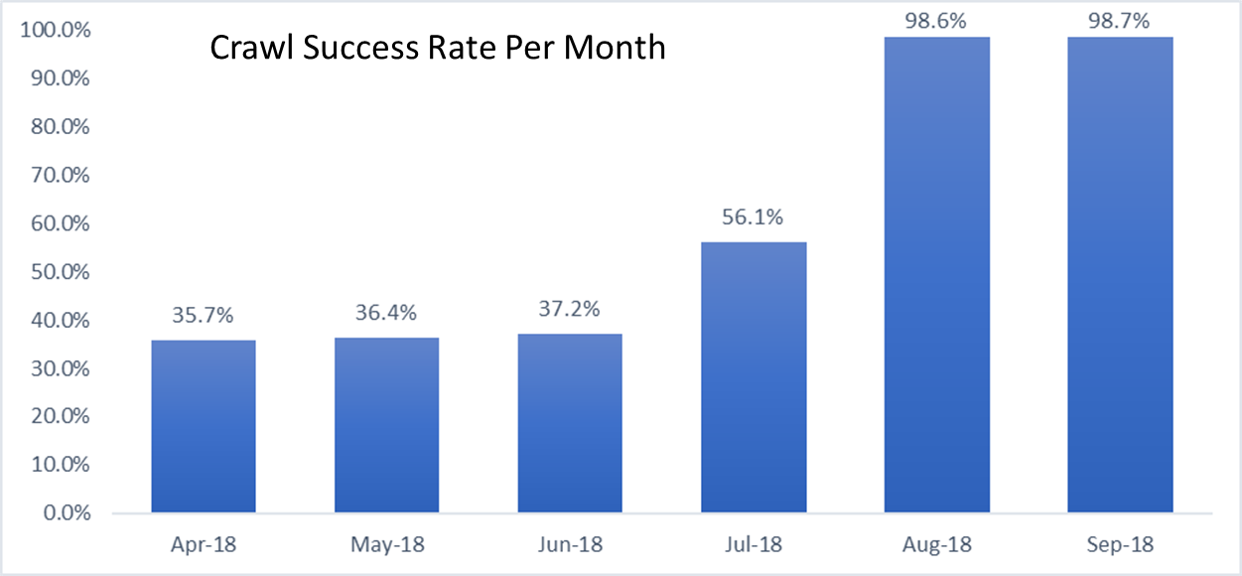
Reviewing our crawling data, we discovered that bingbot was over-crawling the content and we were using more resources then necessary to check and re-check that the historical pages maintained static in nature. What we learned was that we could optimize our system to avoid fetching the same content over and over, and instead check periodically for major changes. This resulted in about 40% crawl saving on this site!
![]()
![]()
While our work in identified patterns for largely static content identified an opportunity to reduce crawling for this “class” of websites (slow and rarely changing content) and in the following posts we’ll share more learnings.
Our work with improving crawler efficiency is not done yet, and we’ve got a lot of opportunity ahead of us to continue to improve our crawler’s efficiency and abilities across the hundreds of different types of data that are used to evaluate our crawler scheduling algorithms. The next step is to continue to identify patterns that apply to a multitude of websites, so we can scale our efforts and be more efficient with crawling everywhere.
Stay tuned! Next in this series of posts related to bingbot and our crawler, we’ll provide visibility on the main criteria involved in defining bingbots Crawl Quota and Crawl Frequency per site. I hope you are still looking forward to learning more about how we improve crawl efficiency and as always, we look forward to seeing your comments and feedback.
Thanks!
Cheng Lu
Principal Software Engineering Manager
Microsoft - Bing
Fabrice Canel
Principal Program Manager
Microsoft - Bing
In part 2 of our bingbot series Principal Software Engineering Managing of the crawl team Cheng Lu shares one example of how we’ve optimized our processes to maximize crawl efficiency for large web sites whose content remains static, or unchanging.
Keeping Indexed Content Current and limiting crawling on content that has changed
When most people conduct a search they typically are looking for the most recent content published; however, the search engine results may link to webpages that were published days ago to years ago. This is a challenge, especially when searchers are wanting to keep up with breaking news and the latest trends by accessing the most up-to-date content online. The internet and search index are full of ghosts of yester-years past, that are often resurrected by the power of search engines. For instance, I was able to retrieve the Microsoft 1996 annual report. Interesting, yes, especially if I need to do a historical report, but if I'm looking for the current annual investment report, it is not so useful. The crawler also needs to have discovered, crawled and indexed the latest Microsoft annual report in order for me to discover it when I do a search.
The challenge for bingbot is that it can't fetch a web page only once. Once a page is published, the search engine must fetch the page regularly to verify that the content has not been updated and that the page is not a dead link. Defining when to fetch the web page next is the hard problem we are looking to optimize with your help.
Case Study: Cornell University Library - A great source of knowledge with many static, unchanging web pages
One challenge that we are trying to address is how often should bingbot crawl a site to fetch the content. The answer depends on the frequency of which the content is edited and updated.
The Cornell University Library empowers Cornell's research and learning community with deep expertise, innovative services, and outstanding collections strengthened by strategic partnerships. Their web site https://arxiv.org/ is a mine of relevant information and it contains millions of web pages on a range of topic from Physics, to Science to Economics. Not only do they have millions of webpages and PDF files related to computer science, they even have content related to crawling and indexing websites.
Identifying patterns to allow bingbot to reduce crawl frequency
While new web pages may be posted daily, and some pages are updated on a regular basis, most of the content within the Cornell University Library is not edited for month and even years. The content is by in large static and unedited. By unedited, I mean that the HTML may change a little, for example {copyright 2018} will {become 2019} on January 1st, the CSS and style sheet may change a little; however such changes are not relevant for updating the indexed content within Bing. The content of the page is still the same. Additionally, only few articles are deleted every year. Their library index increases in size with new and updated research, without substantially changing the content of the historically indexed research.
Reviewing our crawling data, we discovered that bingbot was over-crawling the content and we were using more resources then necessary to check and re-check that the historical pages maintained static in nature. What we learned was that we could optimize our system to avoid fetching the same content over and over, and instead check periodically for major changes. This resulted in about 40% crawl saving on this site!
While our work in identified patterns for largely static content identified an opportunity to reduce crawling for this “class” of websites (slow and rarely changing content) and in the following posts we’ll share more learnings.
Our work with improving crawler efficiency is not done yet, and we’ve got a lot of opportunity ahead of us to continue to improve our crawler’s efficiency and abilities across the hundreds of different types of data that are used to evaluate our crawler scheduling algorithms. The next step is to continue to identify patterns that apply to a multitude of websites, so we can scale our efforts and be more efficient with crawling everywhere.
Stay tuned! Next in this series of posts related to bingbot and our crawler, we’ll provide visibility on the main criteria involved in defining bingbots Crawl Quota and Crawl Frequency per site. I hope you are still looking forward to learning more about how we improve crawl efficiency and as always, we look forward to seeing your comments and feedback.
Thanks!
Cheng Lu
Principal Software Engineering Manager
Microsoft - Bing
Fabrice Canel
Principal Program Manager
Microsoft - Bing
↧
↧
When the numbers don’t tell the whole story
Anscombe's Quartet is a famous collection of four small data sets — just 11 (x,y) pairs each — that was developed in the 1970s to emphasize the fact that sometimes, numerical summaries of data aren't enough. (For a modern take on this idea, see also the Datasaurus Dozen.) In this case, it takes visualizing the data to realize that the for data sets are qualitatively very different, even though the means, variances, and regression coefficients are all the same. In the video below for Guy in a Cube, Buck Woody uses R to summarize the data (which is conveniently built into R) and visualize it using an R script in Power BI.
The video also makes for a nice introduction to R for those new to statistics, and also demonstrates using R code to generate graphics in Power BI.
↧
Bringing .NET application performance analysis to Linux
Both the Windows and Linux ecosystems have a swath of battle-hardened performance analysis and investigation tools. But up until recently, developers and platform engineers could use none of these tools with .NET applications on Linux.
Getting them to work with .NET involved collaboration across many open source communities. The .NET team at Microsoft and the LTTng community worked together to bring .NET application performance analysis to Linux. Since one of this project’s goals was to avoid reinventing the wheel—and to allow existing workflows to be used for .NET applications on Linux—the .NET team chose to enable usage of popular Linux tools such as LTTng and perf to enable performance analysis of .NET core applications.
We worked with the team at EfficiOS to make this LTTNG collaboration happen. They wrote wrote and published a deeper dive into our collaboration in the Bringing .NET application performance analysis to Linux post on the Lttng.org blog. It covers some of the work involved in enabling performance analysis of .NET Core applications on Linux: what works, what doesn’t, and future plans. Take a look at their post to learn more about Linux performance analysis.
↧
AI, Machine Learning and Data Science Roundup: October 2018
A monthly roundup of news about Artificial Intelligence, Machine Learning and Data Science. This is an eclectic collection of interesting blog posts, software announcements and data applications from Microsoft and elsewhere that I've noted over the past month or so.
Open Source AI, ML & Data Science News
PyTorch 1.0 is now in preview, and brings a streamlined workflow from model development to production. Relatedly, Sam Charrington compares the growing PyTorch ecosystem with that of Tensorflow.
Tensorflow 1.11 is released, with binaries for cuDNN 7.2 and TensorRT 4, and new functions for querying kernels.
fastai, a new open library for deep learning built on PyTorch, has been released by fast.ai. It provides a single, consistent API for many deep learning applications and data types.
The R packages keras and tensorflow now allow definition of models that take advantage of eager execution.
Anaconda can now install and manage Tensorflow as a conda package.
Industry News
PyXLL, a commercial Excel add-in for calling Python functions from Excel.
IBM releases AI Fairness 360, an open source toolkit for investigating and mitigating bias in machine learning models.
Google open sources a TensorFlow package for Active Question Answering, a reinforcement learning based method to train artificial agents to answer natural-language questions.
Google Cloud Platform adds PyTorch support to several services, including Tensorboard, Kubeflow and Deep Learning VM images.
RStudio Package Manager, a commercial product to help organizations manage R packages, has been released.
RStudio adds support for Stan, the Bayesian modeling language.
Databricks releases MLflow 0.7.0, featuring a new R client API that allows you to log parameters, code versions, metrics, and output files when running R code and visualize the results in MLflow.
Cloudera and Hortonworks are merging. Thomas Dinsmore assesses the impact on the machine learning ecosystem.
Dataiku 5 is released. The enterprise data platform adds support for containerized R and Python recipes, and integration with Tensorflow and Keras.
Microsoft News
Microsoft has opened a new AI research facility in Shanghai in conjunction with INESA, the China organization developing smart city solutions.
SQL Server 2019 will provide integration with "big data clusters": external SQL Server, Spark or HDFS containers managed in Kubernetes. For AI and ML workloads, you can run Spark or SQL Server's R, Python and Java extensions against the cluster data.
Azure Machine Learning Services now provides Python developer libraries for data preparation, experiment tracking and model management, training on GPU clusters, automated model search and hyperparameter optimization, deploying trained models as containers, and many other new capabilities.
Visual Studio Code Tools for AI has been updated to provide a convenient interface to Azure Machine Learning for users of the popular open-source editor.
Speech Service in Azure Cognitive Services is now generally available, and includes a new neural text-to-speech capability for humanlike synthesized spech.
Azure Databricks is now supported in more regions, offers GPU support for deep learning, and Databricks Delta is now available (in preview) for transactional data capabilities.
Microsoft Bot Framework SDK v4 is now available. The Ignite presentation "Creating Enterprise-Scale Intelligent Agents and Bots" provides an overview and several examples.
Cortana Skills Kit for Enterprise, a development platform based on Azure Bot Service and Language Understanding, is now in private preview.
ONNX Runtime, a high-performance engine for executing trained models represented in the open ONNX format, is now in preview.
PyTorch is now supported in many Azure services, including Azure Machine Learning service, Data Science Virtual Machine, Azure Notebooks, and Visual Studio Code Tools for AI.
The Microsoft Infer.NET machine learning framework has been released as open source. An online book, Model-Based Machine Learning, describes its probabilistic approach with several in-depth examples.
Learning resources
Microsoft Learn, which provides free interactive training for the Azure platform, is now available. Modules include Deep Learning with PyTorch and Computer Vision with Tensorflow.
A tutorial on converting a PyTorch model to ONNX, the cross-platform model-sharing format.
Chromebook Data Science, a free course in Data Science and R from the Johns Hopkins Data Science lab that requires only a browser to take.
Applications
The Ethics Certification Program for Autonomous and Intelligent Systems, a new IEEE standard with the goal of advancing transparency and reducing algorithmic bias in AI systems.
The fast.ai research datasets collection, which includes MNIST, CIFAR 10 and Imagenet, is now available on AWS Open Data.
A comprehensive list of AI Ethics resources, published by fast.ai.
Snip Insights, a Microsoft AI Lab project for image analysis and text extraction from screenshots.
Azure Healthcare AI blueprint, a process to deploy a HIPAA and HITRUST compliant environment in Azure for managing and running healthcare AI experiments.
Find previous editions of the monthly AI roundup here
↧
It’s time to connect your products — here’s why
This post was co-authored by Peter Cooper, Senior Product Marketing Manager, Azure IoT and Mark Pendergrast, Director of Product Marketing, Azure.
What are connected products? They’re not some science experiment coming to us in the future. They’re already a part of everyday life. Smart thermostats remotely control home heating and cooling. Printers automatically order new ink cartridges before they run out. Wearable medical devices capture data that helps drive health decisions.
These products have one thing in common: They are practical, profitable applications of the Internet of Things (IoT), a tech sector that will generate an estimated $4 trillion to $11 trillion in revenue annually by 2025. Via internet connections, these products send massive amounts of data to the cloud where it can be crunched into valuable, actionable insights for users.
Early adopters are realizing the advantages. The average revenue increase achieved from IoT solutions was 15.6 percent, with some achieving gains as high as 64 percent.

Three main use cases for connected products
To capture your share of this market by offering connected products, clarifying the right use case is the first big step. There are three main approaches: monitoring, control, and automation.
- Monitoring: Tracking a product’s condition, environment, and usage to enable performance optimization, alerting, and automated maintenance scheduling. For example, Sandvik machining tools constantly send data to Azure IoT, enabling the company to identify and fix issues as a value-added service.
- Control: Remotely changing a product’s state or causing it to take an action. Omnivex, a leader in intelligent digital signage, designed its Moxie communications platform to run on Azure IoT, enabling visualizations to be updated remotely.
- Automation: Enabling products to coordinate and act without human intervention. Kohler Konnect has developed end-to-end home automation based on individuals’ lifestyles. Products work together seamlessly, such as when setting a bathroom’s morning air and water temperature and lighting.
Companies that connect products using IoT can offer new product features and create new revenue streams. They use the data collected to personalize customer experiences, increase reliability, reduce costs, and learn how products can be improved. Businesses that once sold only physical goods are adding IoT-driven services to the mix, creating new lines of business by monetizing data or offering predictive maintenance. Internally, the data from connected products can drive new innovations based on usage insights — such as the way Rolls-Royce feeds data from its connected jet engines to its design and engineering teams.
Two pitfalls to avoid
Although the revenue potential is huge, connected products require careful planning to succeed. Consider the unique requirements before you embark on a specific project — security being one of the most important. For example, one manufacturer of home automation systems released a product to the public that exposed its interface to search engines and didn’t require a username or password. A reporter was able to search online for homes with the system and take control of functions such as lighting.
Insufficiently robust technology can also be a blocker. When users are relying on your connected products for important services, you have to guarantee reliability. A manufacturer of automatic pet feeders saw its service go down for half a day when one of its infrastructure partners experienced a server failure. Such incidents negatively impact customer trust and can cause significant reputational damage.
The lesson is this: If you’re going to connect your products, do it right. IoT solutions have many layers, and making them all work well together is essential to success. That’s the subject of our next post in this series, where I’ll highlight best practices to help you enter this rapidly expanding market. For in-depth guidance on building a connected products strategy, read our white paper.
↧
↧
Test Analytics in Azure Pipelines is now at your fingertips
You have walked the right path, adopted DevOps, setup tools for CI and CD and embraced continuous testing all the way in your software development process. Are you done? Keeping the pipeline healthy and making it effective is KEY to your DevOps ongoing journey. Some time back we introduced Analytics in Azure Pipeline with Top... Read More
↧
Microsoft named a 2018 Gartner Peer Insights Customers’ Choice for Content Collaboration Platforms (CCP)
Microsoft has been recognized as a 2018 Gartner Peer Insights Customers’ Choice for Content Collaboration Platforms (CCP). Our team takes great pride in this distinction, as customer feedback continues to shape our products and services.
In its announcement Gartner explains, “The Gartner Peer Insights Customers’ Choice is a recognition of vendors in this market by verified end-user professionals, taking into account both the number of reviews and the overall user ratings.” To ensure fair evaluation, Gartner maintains rigorous criteria for recognizing vendors with a high customer satisfaction rate.
For this distinction, a vendor must have a minimum of 50 published reviews with an average overall rating of 4.2 stars or higher.
Here are a few customer quotes from the over 300 reviews Microsoft has received for OneDrive:
“The benefits of OneDrive are unmatched: Collaborate in real-time with Office document editing, including version control, ease of sharing documents with associates, and simple file access from iOS and Android devices.”
—Asset Management Audit Analyst (read full review)
“You can’t go wrong with OneDrive for Business especially if you are already in the Microsoft 365 ecosystem. We used it to replace old file servers for shared folders and it has proven far cheaper and easier to use and maintain.”
—Global Service Delivery Manager, Healthcare (read full review)
“OneDrive allows for the same compliance and security configuration as Office 365, which makes it really easy for us to ensure that data needs to be secured is secured.”
—Project Manager, Services Industry (read full review)
“This product is unbelievable. So easy to install. It comes with Office 365 so when that is installed, BAM it’s done.”
—Director of Information Security, Education (read full review)
Read more reviews for Microsoft.
More than 400,000 organizations have OneDrive and SharePoint in Office 365, including 85 percent of the Fortune 500. The OneDrive team has been working overtime to deliver new innovations and value as part of their subscriptions. We take deep pride in these positive reviews as well as recent customer success stories from MGM Resorts International, Walmart, Johnson Controls International, Textron, and Autodesk.
To all our customers who submitted reviews, thank you! These reviews mold our products and our customer journey, and we look forward to building on the experience that earned us this distinction!
![]()
Gartner Peer Insights Customers’ Choice constitutes the subjective opinions of individual end-user reviews, ratings, and data applied against a documented methodology; they neither represent the views of, nor constitute an endorsement by, Gartner or its affiliates.
The post Microsoft named a 2018 Gartner Peer Insights Customers’ Choice for Content Collaboration Platforms (CCP) appeared first on Microsoft 365 Blog.
↧
Microsoft Store app and game submission deadlines for the 2018 holiday season
The holidays are right around the corner and to take advantage of the holiday traffic increases we see in Microsoft Store, you’ll want to update or submit your app or game no later than Monday, November 13th for Thanksgiving (US) and Thursday, December 13th for the Christmas holiday. You can see the full list of submission deadlines below.
Updating or submitting your app or game early ensures that they will be available during the holiday season!

The post Microsoft Store app and game submission deadlines for the 2018 holiday season appeared first on Windows Developer Blog.
↧
Qantas empowers employees to do their best work with Microsoft 365, enhancing customer experience
![]()
Today’s post was written by Susan Doniz, Qantas Group chief information officer.
 March 2018 marked an historic event for Qantas and the aviation industry: our inaugural direct Perth to London flight, the first nonstop connection between Australia and Europe. Back in 1947, this “Kangaroo Route” took four days and seven stops. Today, our Boeing 787-9 Dreamliner carries 236 passengers in one 17-hour flight that rides the most favorable winds to make the 14,498-kilometer journey—currently the longest Dreamliner flight in the world.
Technology makes many of these innovations possible: from analyzing a decade of seasonal wind patterns to creating meals that maintain hydration and reduce jetlag, managing the logistics of loading 21,000 items on each flight, and ensuring passenger safety and comfort. When I joined Qantas, I was impressed with the airline’s drive to use technology to deliver the best customer experience. In the complex ecosystem that is an airline, each employee plays a key role in the value chain that contributes in some way to differentiating Qantas within the industry. We use Microsoft intelligent cloud-based business services to empower our 30,000 employees in more than 100 locations to connect with each other and to access information easily. These capabilities are critical for helping everyone at Qantas to be creative about improving our customer experience.
I’m very excited about the promise of reducing complexities across the company through easy-to-use tools that give all employees a voice. We’re encouraging a culture that fosters one global corporate conversation. Intelligent communication apps like Microsoft Teams, one-click video calls, and the Yammer social enterprise network go a long way toward opening dialogue that may have been restricted for a regional airport in the outback. The more we empower people with a voice, the more we can expect creative collaboration that leads to innovative contributions from right across the company.
The other cultural change as we evolve our workplace comes from providing better access to information. Today, customers have more and more digital information available, and it’s only fitting that the same should be true of our employees. Instead of having to search through disparate systems to find answers, we’re putting valuable, targeted information at employees’ fingertips so they can quickly make decisions and provide efficient, proactive customer service.
Easy access to relevant data makes a huge difference to our Firstline Workers. And because Microsoft 365 works with other Microsoft tools, such as Cortana and HoloLens, I can imagine scenarios where we can better collaborate between teams to streamline and enhance the work we do. For instance, engineers might visualize a mechanical part during the design process, then collaborate with others, store and share files, and brainstorm ideas—all using Teams.
A strong identity management service provides the foundation for our new modern workplace. To ensure our 30,000 employees have the information they need without compromising data security, we’re using the integrated set of security-enhancing capabilities in Microsoft 365. These, in addition to the security features embedded in the Office 365 apps, boost our security posture while simplifying how IT manages and secures work environments.
If I could sum it up in one sentence: we want people to be able to say they are doing their best work at Qantas. With Microsoft cloud-based business tools, we are helping them do just that. It’s one very important way that we continue to deliver better a customer experience, one flight at a time.
—Susan Doniz
Read the full case study.
The post Qantas empowers employees to do their best work with Microsoft 365, enhancing customer experience appeared first on Microsoft 365 Blog.
↧
↧
Two considerations for a serverless data streaming scenario
We recently published a blog on a fraud detection solution delivered to banking customers. At the core of the solution is the requirement to completely process a streaming pipeline of telemetry data in real time using a serverless architecture. Two technologies were evaluated for this requirement, Azure Stream Analytics and Azure Functions. This blog describes the evaluation process and the decision to use Azure Functions.
Scenario
A large bank wanted to build a solution to detect fraudulent transactions, submitted through their mobile phone banking channel. The solution is built on a common big data pipeline pattern. High volumes of real-time data are ingested into a cloud service, where a series of data transformations and extraction activities occur. This results in the creation of a feature, and the use of advanced analytics. For the bank, the pipeline had to be very fast and scalable where end-to-end evaluation of each transaction had to complete in less than two seconds.
Pipeline requirements include:
- Scalable and responsive to extreme bursts of ingested event activity. Up to 4 million events and 8 million or more transactions daily.
- Events were ingested as complex JSON files, each containing from two to five individual bank transactions. Each JSON file had to be parsed, and individual transactions extracted, processed, and evaluated for fraud.
- Events and transactions had to be processed in order, with guarantees that duplicates would not be processed. The reason for this requirement is that behavioral data was extracted from each transaction to create customer and account profiles. If events were not processed sequentially, the calculations and aggregations used to create the profiles and feature set for fraud prediction would be invalid and impact the accuracy of the machine learning model.
- Reference data and the ability to do dynamic look-ups was a critical component in the pipeline processing. For this scenario, reference data could be updated at any point during the day.
- An architecture that could be deployed with ARM templates, making integration with CI/CD and DevOps processes easier. A template architecture meant the entire fraud detection pipeline architecture could be easily redeployed to facilitate testing or to quickly extend the bank’s fraud detection capabilities to additional banking channels such as internet banking.
To meet these requirements, we evaluated Azure Stream Analytics and Azure Functions. Both technologies are managed services with similar capabilities:
- Easy configuration and setup.
- Designed to handle real-time, large-scale event processing.
- Out-of-the-box integration with Event Hubs, Azure SQL, Azure ML, and other managed services
Both technologies are well suited for a real-time streaming, big data scenario.
How did we do it?
It was important to explore both technologies to determine which one was a better fit for the specific situation. Two aspects to the solution required deep validation. How long does it take to process a single message end-to-end? And how many concurrent messages can be processed end-to-end?
We considered two initial architectural patterns:
- Option #1 – Data streams into three instances of Event Hubs and is consumed by Azure Stream Analytics.
- Option #2 – Data streams into a single instance of Event Hubs and is consumed by a single Azure function.

In addition to the Azure services referenced previously, we drove the test harness using a message replayer to send events to Event Hub. With modifications to use data specifics for this scenario, we used TelcoGenerator, which is a call-event generation app downloadable from Microsoft. The source code is available on GitHub.
What did we learn?
Both Azure Stream Analytics and Azure Functions are easy to configure and within minutes can be set up to consume massive volumes of telemetry data from Azure Event Hub. Load testing was performed and results were captured using telemetry, was captured through Azure Application Insights. Key metrics clearly showed that Azure Functions delivered better performance and throughput for this particular workflow:
|
Architecture |
3 Event Hubs + Stream Analytics |
1 Event Hub + 1 Azure Function |
|
Minimum time to process a single message end to end (lower is better) |
8,000 millisecond |
69 millisecond |
|
Average number of events processed per minute (higher is better) |
300 |
8,300 |
Table: Load testing results
While some functionality overlaps occur between the two approaches, key differentiators that drove the selection of Azure Functions included the following:
- Both technologies provide the capability to process the pipeline in batches, but Azure Functions provides the ability to evaluate and execute one event at a time with millisecond latency. In addition, with Azure Functions, events were guaranteed to process in order.
- The coding paradigms are different. Azure Stream Analytics has a SQL-like query processing language and Azure Functions supports C#, JavaScript, Python, and other languages. For this solution, the Azure Function was written in C#, which enabled more sophisticated business logic beyond the query capabilities of windowing.
- An Azure Function integrated with Azure SQL provides multiple benefits:
- Transactional control over event and transaction processing. If processing errors were found with a transaction in an event, all the transactions contained in the event could be rolled back.
- Doing the bulk of data preparation using Azure SQL in-memory processing and native stored procedures was very fast.
- Dynamic changes to reference data or business logic are more easily accommodated with Azure Functions. Reference tables and the stored process could easily and quickly be updated in Azure SQL and used immediately in subsequent executions. With Azure Stream Analytics (ASA), these types of changes require modification of the ASA query and redeployment of the pipeline.
- JSON file processing was very intensive and complex, with up to five individual bank transactions extracted from each JSON file. JSON parsing tended to be much faster with Azure Function because it leverages native JSON capabilities in .NET Framework. Azure Stream Analytics also works with complex data types but processing with functions such as “GetArrayElement” are not as fast as native .NET functions.
- Both services had an initial issue with locking on the Event Hubs consumer groups when scaling. After experimenting with configuration parameters described in “A fast, serverless, big data pipeline powered by a single Azure Function”, a single function was all that was needed to meet the big data volume requirements for this solution.
- With an Azure Function, state can be more easily saved between processing activities.
- It is easier to incorporate an Azure Functions pipeline into a DevOps release process, and easier to develop unit tests for Azure Functions methods. For this scenario, it was helpful to develop unit tests for data values and data type checks for the Azure Function.
Recommended next steps
As solution requirements are refined, it can become important for technology decision makers to know how a data pipeline will perform with sudden fluctuations in an event and data volumes. As you consider technologies for your data pipeline solution, consider load testing the pipeline. To get you started, visit the following links:
- Alerting on fraudulent transactions is a common use case for Azure Stream Analytics. Get started using Azure Stream Analytics: Real-time fraud detection.
- An Event Hub/Azure Functions solution, but not the mobile bank solution.
- Read more on configuration parameters in A fast, serverless, big data pipeline powered by a single Azure Function.
- The full architecture for the bank fraud solution referenced in this blog can be found in the Mobile bank fraud solution guide.
Special thank you to Cedric Labuschagne, Chris Cook, and Eujon Sellers for their collaboration on this blog.
↧
Azure Cosmos DB partitioning design patterns – Part 1
In this article, you will learn how to use partition keys to efficiently distribute data, improve application performance, and enable faster look-up. The pre-requisites of this article are general knowledge of Azure Cosmos DB and a good understanding of change feed, request unit (RU), and Azure Functions.
Imagine you have data which you would like to insert with high throughput and query on two or more different keys. In this scenario, suppose you work for an airline company and need to store user reservation information in a collection. User data is defined as:
{
     UserId: user@email.com,
     FirstName: John,
     LastName: Doe,
     PNR: 2345423,
     CityOfOrigin: Seattle,
     CityOfDestination: London,
     DOB: 12.2.76,
     other details ….
}
Out of many possible values, you choose “UserId” (user email address) as the partition key. This is a good choice for a partition key because “UserId” is unique for every user, ensuring your data remains well distributed. Your data is distributed evenly among all partitions, as shown in Figure 1. However, when you are querying the data you do not always have a “UserId”. Sometimes you want to query the data by user last name or user Passenger Name Record (PNR) number.

Figure 1: Data distributed evenly across partitions
Azure Cosmos DB indexes all data by default. If you try to query the data by "LastName", you will get the result, but it will cost you more request units (RU/s) because queries without partition key become fan-out queries. Fan-out queries check all partitions, which will cost you extra RU/s and may affect the performance of your application. If you have a small number of partitions with less data, you may not perceive any significant side effects of fan-out queries, but when you start getting in high numbers of partitions and large amounts of data, fan-out queries can be detrimental to your applications. Infrequent cross partition query is fine, but if it is a frequent query, then what is the solution?
One option is to have two more lookup collections PNR and “LastName” for the mapping of PNR to “UserId”, and “LastName” to “UserId”. The PNR collection will have PNR as the partition key and row key and “UserId” as the value.

These different lookup collections will make your application more efficient. To lookup detail by PNR, first query the PNR collection to get the “UserId”. Then use “UserId” to query user collection for all details. These two calls can complete within a few milliseconds and will consume fewer RU/s than a single fan-out query. Most of the point lookup can complete within one to two milliseconds. Even after two lookups, you can be done within 10 milliseconds for most of the queries.
You may not want a few extra milliseconds added to calls and instead may decide to duplicate the data in the PNR and “LastName” collections. While this will enable fast look-up, it isn’t recommended because it may add complexity and costs when data is updated. Ultimately, you must balance requirements, performance, and complexity. Starting with a simple solution is often the best approach.
Now let’s look at the distribution of your data in different collections. For example, if you look at the “LastName” collection you will find that the data is not equally distributed because there are more people with the last name “Smith” than “Zubrkee”. In this case, the data will look very much like Figure 2.

Figure 2: Data unevenly distributed across partitions
The data in this scenario is distributed unevenly, with some full partitions and others greatly underused. This type of data distribution creates many problems.
- The total RU/s for a collection is divided amongst all partitions. This means that 1000 RU/s will be distributed across five partitions as 200 RU/s for each partition. If you try to write more than 200 RU/s to any of these partitions, calls will begin to fail as you cross the threshold. If a developer finds they’re getting throttled on 300 RU/s despite having 1000 RU/s allocated at the collection level, the issue is often that a bad partition key is hitting only one partition.
- A partition key can currently have 10 GB of data at maximum (this may change in future), making it important to use a partition key which fills all partitions efficiently. In the example of “LastName”, a more granular partition key is needed to evenly distribute data. Since the data also includes “Origin City”, a new partition key can be made from “LastName” and “Origin City” and the results will look like Figure 3 below.

Figure 3: Data distribution after applying granular partition key
This looks much better. The data is distributed more evenly, and travelers can easily and quickly look-up their reservations by simply entering their last name and city of origin.
Now that you’ve distributed your data evenly, how do you populate the other collection? For this, we need to understand change feed. Change feed exposes all the internal changes happening inside a collection. Change feed support in Azure Cosmos DB works by listening to an Azure Cosmos DB collection for any changes. It then outputs the sorted list of documents that were changed in the order in which they were modified. The changes are persisted, can be processed asynchronously and incrementally, and the output can be distributed across one or more consumers for parallel processing.
The change feed is available for each partition key range within the document collection and thus can be distributed across one or more consumers for parallel processing. Whenever a record is inserted into the user collection it will appear in change feed. The easiest way to consume change feed is Azure Function. Azure Functions is a serverless compute service that enables you to run code-on-demand without having to explicitly provision or manage infrastructure. Use Azure Functions to run a script or piece of code in response to a variety of events.

When you consume change feed through Azure function, all the inserted/changed documents come in your function as a parameter of your function.
public static async Task Run(IReadOnlyList<Document> input, TraceWriter log)
Once you have the whole document in your function, you can update the PNR and “LastName” collection accordingly.
Watch this screencast to learn more about how to use Azure Cosmos DB, Azure Function and change feed or read about change feed:
↧
Query Azure Storage analytics logs in Azure Log Analytics
Log Analytics is a service that collects telemetry and other data from a variety of sources and provide a query language for advanced analytics. After you post logging data to Log Analytics workspace with HTTP Data Collector API, you are able to query logs for troubleshooting, visualize the data for monitoring, or even create alerts based on log search. For more details, see Log Analytics.
Tighter integration with Log Analytics makes troubleshooting storage operations much easier. In this blog, we share how to convert Azure Storage analytics logs and post to Azure Log Analytics workspace. Then, you can use analysis features in Log Analytics for Azure Storage (Blob, Table, and Queue). The major steps include:
- Create workspace in Log Analytics
- Convert Storage Analytics logs to JSON
- Post logs to Log Analytics workspace
- Query logs in Log Analytics workspace
- Visualize log query in Log Analytics workspace
Create workspace in Log Analytics
First, you will need to create a workspace in Log Analytics. The following screenshot shows how to create it in Azure Portal.

Convert Storage Analytics logs to JSON
Azure Storage provides analytics logs for Blob, Table, and Queue. The analytics logs are stored as blobs in "$logs" container within the same storage account. The blob name pattern looks like "blob/2018/10/07/0000/000000.log." You can use Azure Storage Explorer to browse the structures and log files. The following screenshot shows the structure in Azure Storage Explorer:

In each log file, each line is one log record for one request divided by semicolon. You can find schema definition in Storage Analytics Log Format. The following log record shows as a sample:
1.0;2014-06-19T22:59:23.1967767Z;GetBlob;AnonymousSuccess;200;17;16;anonymous;;storagesample;blob;"https://storagesample.blob.core.windows.net/sample-container1/00001.txt";"/storagesample/sample-container1/00001.txt";61d2e3f6-bcb7-4cd1-a81e-4f8f497f0da2;0;192.100.0.102:4362;2014-02-14;283;0;354;23;0;;;""0x8D15A2913C934DE"";Thursday, 19-Jun-14 22:58:10 GMT;;"WA-Storage/4.0.1 (.NET CLR 4.0.30319.34014; Win32NT 6.3.9600.0)";;"44dfd78e-7288-4898-8f70-c3478983d3b6"
Before the next step, we need to convert log records to JSON. You can use any script to convert but the following cases are required to handle during conversion:
- Semicolon mark in the columns: Some columns like request-url or user-agent-header may contain semicolon mark. It should be encoded before split with semicolon. After split, it should be decoded back.
- Quote mark in the columns: Some columns like client-request-id or etag-identifier may contain quote mark. While adding quote mark for other key values, it should be ignored for these columns.
- Use the column definition as key name from Storage Analytics Log Format, so you easily query with them in Log Analytics. Examples: version-number, or request-start-time.
The following sample shows what a prepared JSON looks like for one log record:
[{"version-number":"1.0","request-start-time":"2018-10-07T20:00:52.4036565Z","operation-type":"CreateContainer","request-status":"ContainerAlreadyExists","http-status-code":"409","end-to-end-latency-in-ms":"6","server-latency-in-ms":"6","authentication-type":"authenticated","requester-account-name":"testaccount","owner-account-name":"testaccount","service-type":"blob","request-url":"https://testaccount.blob.core.windows.net/insights-metrics-pt1m?restype=container","requested-object-key":"/testaccount/insights-metrics-pt1m","request-id-header":"99999999-c01e-0085-4a78-000000000000","operation-count":"0","requester-ip-address":"100.101.102.103:12345","request-version-header":"2017-04-17","request-header-size":"432","request-packet-size":"0","response-header-size":"145","response-packet-size":"230","request-content-length":"0","request-md5":"","server-md5":"","etag-identifier":"","last-modified-time":"","conditions-used":"","user-agent-header":"Azure-Storage/8.4.0 (.NET CLR 4.0.30319.42000; Win32NT 6.2.9200.0)","referrer-header":"","client-request-id":"88888888-ed38-4a90-bb3f-000000000000"}]
Post logs to Log Analytics workspace
Azure Log Analytics provides HTTP Data Collector API to post custom log data Log Analytics workspace. You can follow the sample code in the article to send the log json payload prepared in the last step.
Post-LogAnalyticsData -customerId $customerId -sharedKey $sharedKey -body ([System.Text.Encoding]::UTF8.GetBytes($json)) -logType $logType
Query logs in Log Analytics workspace
If you create record type like MyStorageLogs1 in posting logs, you will use MyStorageLogs1_CL as stream name to query. The following screenshot shows how to query imported Storage analytics logs in Log Analytics.

Visualize log query in Log Analytics
If you want to aggregate the query result and look for the pattern or trend, it can be achieved with query and visualization easily in Log Analytics. The following screenshot shows how to visualize query result:

Sample code
A sample Powershell script is provided to show how to convert Storage Analytics log data to JSON format and post the JSON data to a Log Analytics workspace.
Next steps
Read more to continue learning about Storage Analytics and Log Analytics, and sign up for an Azure create a Storage account.
When you read log data from Storage account, there is a cost from read operations. For detailed pricing, visit Blobs pricing. Also note, Log Analytics charges you based on Azure Monitor pricing.
Azure Storage is working with the Azure Monitor team in unifying the logging pipeline. We hope to have built-in integration with Log Analytics for Azure Storage logs soon, and we will keep you posted when the plan is determined. If you have any feedback or suggestions, you can email Azure Storage Analytics Feedback.
↧
What’s new in PowerShell in Azure Cloud Shell
At Microsoft Ignite 2018, PowerShell in Azure Cloud Shell became generally available. Azure Cloud Shell provides an interactive, browser-accessible, authenticated shell for managing Azure resources from virtually anywhere. With multiple access points, including the Azure portal, the stand-alone experience, Azure documentation, the Azure mobile app, and the Azure Account Extension for Visual Studio Code, you can easily gain access to PowerShell in Cloud Shell to manage and deploy Azure resources.
Improvements
Since the public preview in September 2017, we’ve incorporated feedback from the community including faster start-up time, PowerShell Core, consistent tooling with Bash, persistent tool settings, and more.
Faster start-up
At the beginning of PowerShell in Cloud Shell’s public preview, the experience opened in about 120 seconds. Now, with many performance updates, the PowerShell experience is available in about the same amount of time as a Bash experience.
PowerShell Core
PowerShell is now cross-platform, open-source, and built for heterogeneous environments and the hybrid cloud. With the Azure PowerShell and Azure Active Directory (AAD) modules for PowerShell Core, both now in preview, you are still able to manage your Azure resources in a consistent manner. By moving to PowerShell Core, the PowerShell experience in Cloud Shell can now run on a Linux container.
Consistent tooling
With PowerShell running on Linux, you get a consistent toolset experience across the Bash and PowerShell experiences. Additionally, all contents of the home directory are persisted, not just the contents of the clouddrive. This means that settings for tools, such as GIT and SSH, are persisted across sessions and are available the next time you use Cloud Shell.
Azure VM Remoting cmdlets
You have access to 4 new cmdlets, which include Enable-AzVMPSRemoting, Disable-AzVMPSRemoting, Invoke-AzVMCommand, and Enter-AzVM. These cmdlets enable you to easily enable PowerShell Remoting on both Linux and Windows virtual machines using ssh and wsman protocols respectively. This allows you to connect interactively to individual machines, or one-to-many for automated tasks with PowerShell Remoting.
Watch the “PowerShell in Azure Cloud Shell general availability” Azure Friday video to see demos of these features, as well as an introduction to future functionality!
Get started
Azure Cloud Shell is available through the Azure portal, the stand-alone experience, Azure documentation, the Azure Mobile App, and the Azure Account Extension for Visual Studio Code. Our community of users will always be the core of what drives Azure and Cloud Shell.
We would like to thank you, our end-users and partners, who provide invaluable feedback to help us shape Cloud Shell and create a great experience. We look forward to receiving more through the Azure Cloud Shell UserVoice.
↧
↧
Control and improve your security posture with Azure Secure score
With an increasing number of recommendations and many security vulnerabilities surfaced, it is harder to triage and prioritize your response. In addition to a growing amount of information, you have limited resources and time. Azure Secure score helps you prioritize and triage your response to security recommendations by assigning values to the recommendations that can most help improve your security posture.
Last month at Ignite, we announced that Secure score is a security analytics tool that provides visibility of your organization’s security posture and helps to answer the most important question, “how secure is my workload?” Secure score takes into consideration the severity and the impact of the recommendation. Based on that information, it assigns a numerical value to show how fixing this recommendation can improve your security posture.
When a recommendation is remediated, the recommendation score updates and the overall Secure score is also updated.
The main goals of Secure score are to provide these capabilities to your organization :
- Visualization of the security posture
- Fast triage and suggestions to provide meaningful action to increase your security posture
- Measurement of the workload security over time

Azure Security Center constantly reviews your active recommendations and calculates your secure score based on them. The score of a recommendation is derived from its severity and security best practices that will affect your workload security the most.
The Secure score is calculated based on the ratio between your healthy resources and your total resources. If the number of healthy resources is equal to the total number of resources, you get the highest Secure Score value possible for a recommendation, which can go up to 50. To try to get your Secure score closer to the maximum score, you can fix the unhealthy resources by following the remediation steps in the recommendation.

The overall Secure score is an accumulation of all your recommendations. You can view your overall Secure score across your subscriptions or management groups, depending on the scope you select. The score will vary based on subscription selected and the active recommendations on these subscriptions.
To learn more about Secure score and other Security Center capabilities, visit our documentation.
If you are an existing Security Center customer, Secure score is part of the Free tier of Security Center. If you are new to Security Center, you can get started with Security Center for free.
↧
Announcing CosmosDB Table Async OutputCache Provider Release and ASP.NET Providers Connected Service Extension Update
Through the years, ASP.NET team have been releasing new ASP.NET SessionState and OutputCache providers to help developers make their web applications ready for the cloud environment. Today we are announcing a new OutputCache provider, Microsoft.AspNet.OutputCache.CosmosDBTableAsyncOutputCacheProvider, to enable your applications store the OutputCache data into CosmosDB. It supports both Azure CosmosDB Table and Azure Storage Table.
How to Use CosmosDBTableAsyncOutputCacheProvider
- Open the NuGet package manager and search for Microsoft.AspNet.OutputCache.CosmosDBTableAsyncOutputCacheProvider and install. Make sure that your application is targeted to .NET Framework 4.6.2 or higher version. Download the .NET Framework 4.6.2 Developer Pack if you do not already have it installed.
- The package has dependency on Microsoft.AspNet.OutputCache.OutputCacheModuleAsync Nuget package and Microsoft.Azure.CosmosDB.Table Nuget package. After you install the package, both Microsoft.AspNet.OutputCache.CosmosDBTableAsyncOutputCacheProvider.dll and dependent assemblies will be copied to the Bin folder.
![]()
- Open the web.config file, you will see two new configuration sections are added, caching and appSettings. The first one is to configure the OutputCache provider, you may want to update the table name. The provider will create the table if it doesn’t exist on the configured Azure service instance. The second one is the appSettings for the storage connection string. Depends on the connection string you use, the provider can work with either Azure CosmosDB Table or Azure Storage Table.
![]()
ASP.NET Providers Connected Service Extension Update
5 months ago, we released ASP.NET Providers Connected Service Visual Studio Extension to help the developers to pick the right ASP.NET provider and configure it properly to work with Azure resources. Today we are releasing an update for this extension which enables you configure ComosDB table OutputCache provider and Redis cache OutputCache.
![]()
Summary
The new CosmosDBTableAsyncOutputCacheProvider Nuget package enables your ASP.NET application leverage Azure CosmosDB and Azure Storage to store the OutputCache data. The new ASP.NET Providers Connected Service extension adds more Azure ready ASP.NET providers support. Please try it today and let us know you feedback.


↧
ASP.NET Core 2.2 Parameter Transformers for clean URL generation and slugs in Razor Pages or MVC
I noticed that last week .NET Core 2.2 Preview 3 was released:
You can download and get started with .NET Core 2.2, on Windows, macOS, and Linux:
- .NET Core 2.2 Preview 3 SDK (includes the runtime)
- .NET Core 2.2 Preview 3 Runtime
Docker images are available at microsoft/dotnet for .NET Core and ASP.NET Core.
.NET Core 2.2 Preview 3 can be used with Visual Studio 15.9 Preview 3 (or later), Visual Studio for Mac and Visual Studio Code.
The feature I am most stoked about in ASP.NET 2.2 is a subtle one but I remember implementing it manually many times over the last 10 years. I'm happy to see it nicely integrated into ASP.NET Core's MVC and Razor Pages patterns.
ASP.NET Core 2.2 introduces the concept of Parameter Transformers to routing. Remember there isn't a directly relationship between what's in the URL/Address bar and what's on disk. The routing subsystem handles URLs coming in from the client and routes them to Controllers, but it also generates URLs (strings) when given an Controller and Action.
So if I'm using Razor Pages and I have a file Pages/FancyPants.cshtml I can get to it by default at /FancyPants. I can also "ask" for the URL when I'm creating anchors/links in my Razor Page:
<a class="nav-link text-dark" asp-area="" asp-page="/fancypants">Fancy Pants</a>
Here I'm asking for the page. That asp-page attribute points to a logical page, not a physical file.
We can make an IOutboundParameterTransformer that changes URLs to a format (for example) like a WordPress standard slug in the two-words format.
public class SlugifyParameterTransformer : IOutboundParameterTransformer
{
    public string TransformOutbound(object value)
    {
        if (value == null) { return null; }
        // Slugify value
        return Regex.Replace(value.ToString(), "([a-z])([A-Z])", "$1-$2").ToLower();
    }
}
Then you let the ASP.NET Pipeline know about this transformer, either in Razor Pages...
services.AddMvc()
            .SetCompatibilityVersion(CompatibilityVersion.Version_2_2)
            .AddRazorPagesOptions(options =>
{
    options.Conventions.Add(
        new PageRouteTransformerConvention(
            new SlugifyParameterTransformer()));
});
or in ASP.NET MVC:
services.AddMvc(options =>
{
    options.Conventions.Add(new RouteTokenTransformerConvention(
                                 new SlugifyParameterTransformer()));
});
Now when I run my application, I get my routing both coming in (from the client web browser) and going out (generated via Razor pages. Here I'm hovering over the "Fancy Pants" link at the top of the page. Notice that it's generated /fancy-pants as the URL.

So that same code from above that generates anchor tags <a href= gives me the expected new style of URL, and I only need to change it in one location.
There is also a new service called LinkGenerator that's a singleton you can call outside the context of an HTTP call (without an HttpContext) in order to generate a URL string.
return _linkGenerator.GetPathByAction(
     httpContext,
     controller: "Home",
     action: "Index",
     values: new { id=42 });
This can be useful if you are generating URLs outside of Razor or in some Middleware. There's a lot more little subtle improvements in ASP.NET Core 2.2, but this was the one that I will find the most useful in the near term.
Sponsor: Check out the latest JetBrains Rider with built-in spell checking, enhanced debugger, Docker support, full C# 7.3 support, publishing to IIS and more advanced Unity support.
© 2018 Scott Hanselman. All rights reserved.


↧