Quantcast
Channel: Category Name
Viewing all 10804 articles
Browse latest View live

Announcing .NET Core 3.1

$
0
0

Announcing .NET Core 3.1

We’re excited to announce the release of .NET Core 3.1. It’s really just a small set of fixes and refinements over .NET Core 3.0, which we released just over two months ago. The most important feature is that .NET Core 3.1 is an long-term supported (LTS) release and will be supported for three years. As we’ve done in the past, we wanted to take our time before releasing the next LTS release. The extra two months (after .NET Core 3.0) allowed us to select and implement the right set of improvements over what was already a very stable base. .NET Core 3.1 is now ready to be used wherever your imagination or business need takes it.

You can download .NET Core 3.1, for Windows, macOS, and Linux:

ASP.NET Core and EF Core are also being released today.

Visual Studio 2019 16.4 was also released today and includes .NET Core 3.1. It is a required update to use .NET Core 3.1 with Visual Studio. For Visual Studio 2019 users, we recommend simply updating Visual Studio to 16.4 and instead of separately downloading .NET Core 3.1.

Visual Studio for Mac also supports and includes .NET Core 3.1, in the Visual Studio for Mac 8.4 Preview channel. You will need to opt into the Preview channel to use .NET Core 3.1.

Release notes:

  • .NET Core 3.0 release notes
  • .NET Core 2.2 -> 3.0 API diff
  • .NET Core 3.0 contributor list
  • GitHub release
  • GitHub issue for .NET Core 3.0 issues

The changes in .NET Core 3.1 were primarily focussed on Blazor and Windows Desktop, the two new and large additions in .NET Core 3.0. This includes support for C++/CLI, which has been a regular request for developers targeting Windows.

Before we take a look at what’s new in .NET Core 3.1, let’s take a quick look at the key improvements in .NET Core 3.0, which is the bulk of what’s important to consider for .NET Core 3.1.

Recap of .NET Core 3.0 Improvements

The following key improvements were delivered in .NET Core 3.0. We’ve already heard from developers of big sites that it is working super well for them.

  • .NET Core 3.0 is already battle-tested by being hosted for months at dot.net and on Bing.com. Many other Microsoft teams will soon be deploying large workloads on .NET Core 3.1 in production.
  • Performance is greatly improved across many components and is described in detail at Performance Improvements in .NET Core 3.0 and Hardware Intrinsics in .NET Core.
  • C# 8 add async streams, range/index, more patterns, and nullable reference types. Nullable enables you to directly target the flaws in code that lead to NullReferenceException. The lowest layer of the framework libraries has been annotated, so that you know when to expect null.
  • F# 4.7 focuses on making some thing easier with implicit yield expressions and some syntax relaxations. It also includes support for LangVersion, and ships with nameof and opening of static classes in preview. The F# Core Library now also targets .NET Standard 2.0. You can read more at Announcing F# 4.7.
  • .NET Standard 2.1 increases the set of types you can use in code that can be used woth both .NET Core and Xamarin. .NET Standard 2.1 includes types since .NET Core 2.1.
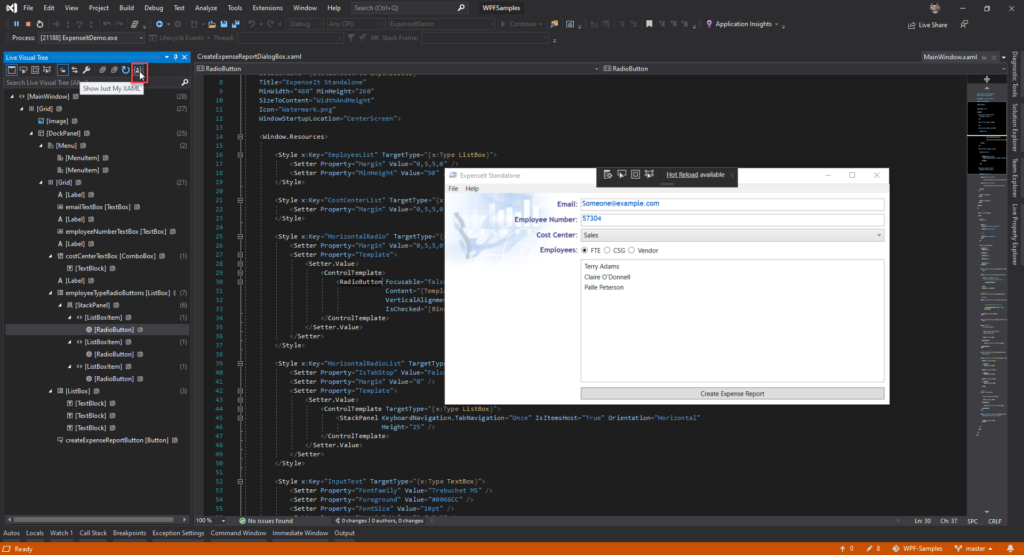
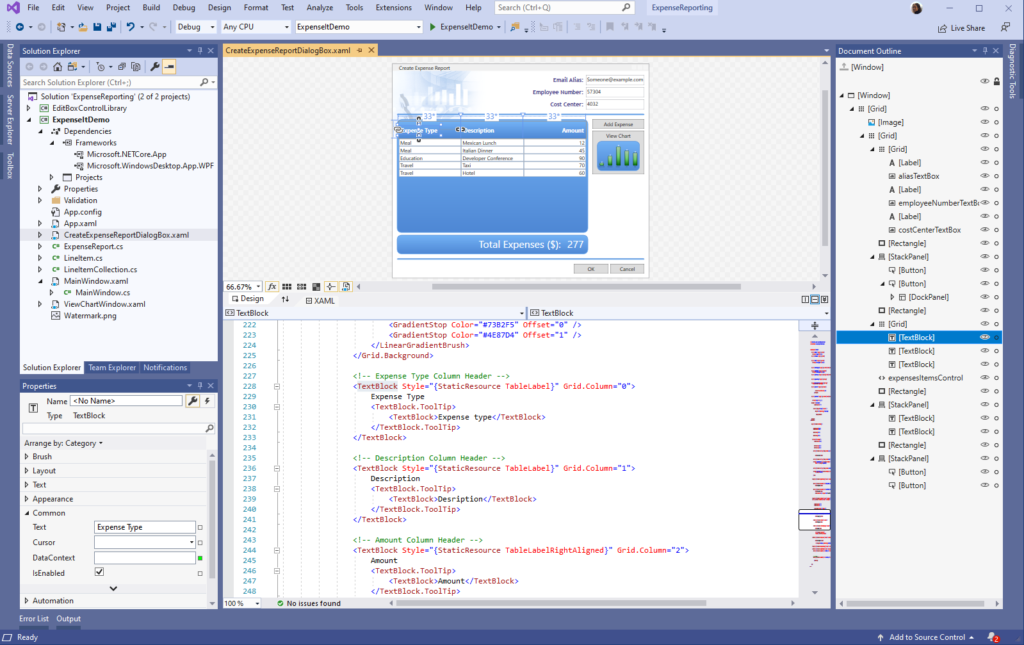
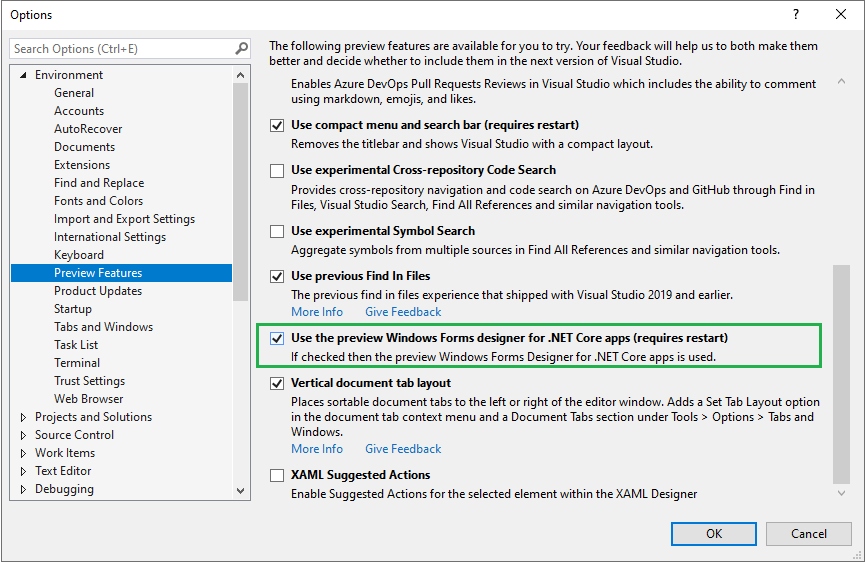
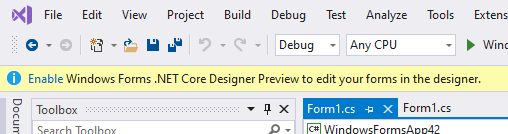
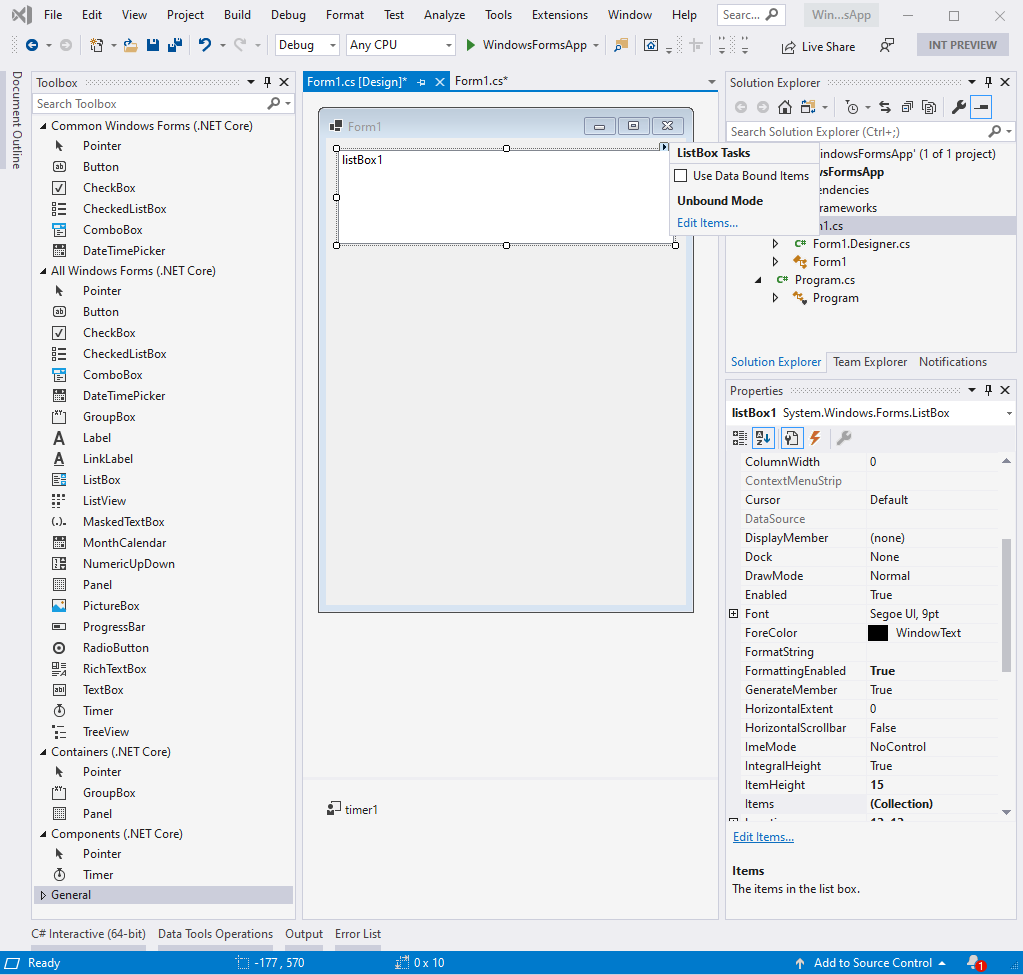
  • Windows Desktop apps are now supported with .NET Core, for both Windows Forms and WPF (and open source). The WPF designer is part of Visual Studio 2019. The Windows Forms designer is in preview and available as a download.
  • .NET Core apps now have executables by default. In past releases, apps needed to be launched via the dotnet command, like dotnet myapp.dll. Apps can now be launched with an app-specific executable, like myapp or ./myapp, depending on the operating system.
  • High performance JSON APIs have been added, for reader/writer, object model and serialization scenarios. These APIs were built from scratch on top of Span<T> and use UTF8 under the covers instead of UTF16 (like string). These APIs minimize allocations, resulting in faster performance, and much less work for the garbage collector. See Try the new System.Text.Json APIs.
  • The garbage collector uses less memory by default, often a lot less. This improvement is very beneficial for scenarios where many applications are hosted on the same server. The garbage collector has also been updated to make better use of large numbers of cores, on machines with >64 cores. See Making CPU configuration better for GC on machines with > 64 CPUs.
  • .NET Core has been hardened for Docker to enable .NET applications to work predictably and efficiently in containers. The garbage collector and thread pool have been updated to work much better when a container has been configured for limited memory or CPU. .NET Core docker images are smaller, particularly the SDK image. See: Running with Server GC in a Small Container Scenario Part 0, Running with Server GC in a Small Container Scenario Part 1 – Hard Limit for the GC Heap and Using .NET and Docker Together – DockerCon 2019 Update.
  • Raspberry Pi and ARM chips are now supported to enable IoT development, including with the remote Visual Studio debugger. You can deploy apps that listen to sensors, and print messages or images on a display, all using the new GPIO APIs. ASP.NET can be used to expose data as an API or as a site that enables configuring an IoT device.

Platform support

.NET Core 3.1 is supported on the following operating systems:

  • Alpine: 3.9+
  • Debian: 9+
  • openSUSE: 42.3+
  • Fedora: 26+
  • Ubuntu: 16.04+
  • RHEL: 6+
  • SLES: 12+
  • macOS: 10.13+
  • Windows Client: 7, 8.1, 10 (1607+)
  • Windows Server: 2012 R2 SP1+

Note: Windows Forms and WPF apps are only functional and supported on Windows.

Chip support follows:

  • x64 on Windows, macOS, and Linux
  • x86 on Windows
  • ARM32 on Windows and Linux
  • ARM64 on Linux (kernel 4.14+)

Note: Please ensure that .NET Core 3.1 ARM64 deployments use Linux kernel 4.14 version or later. For example, Ubuntu 18.04 satisfies this requirement, but 16.04 does not.

Windows Forms Controls Removal

The following Windows Forms controls have been removed from .NET Core 3.1:

  • DataGrid
  • ToolBar
  • ContextMenu
  • Menu
  • MainMenu
  • MenuItem

These controls were replaced with more powerful controls in .NET Framework 2.0, back in 2005. They have not been available by default in the Visual Studio Designer Toolbox for many years. As a result, we decided to remove these controls and focus only on the new ones.

The following replacements are recommended:

Old Control (API) Recommended Replacement Other associated APIs removed
DataGrid DataGridView DataGridCell, DataGridRow, DataGridTableCollection, DataGridColumnCollection, DataGridTableStyle, DataGridColumnStyle, DataGridLineStyle, DataGridParentRowsLabel, DataGridParentRowsLabelStyle, DataGridBoolColumn, DataGridTextBox, GridColumnStylesCollection, GridTableStylesCollection, HitTestType
ToolBar ToolStrip ToolBarAppearance
ToolBarButton ToolStripButton ToolBarButtonClickEventArgs, ToolBarButtonClickEventHandler, ToolBarButtonStyle, ToolBarTextAlign
ContextMenu ContextMenuStrip
Menu ToolStripDropDown, ToolstripDropDownMenu MenuItemCollection
MainMenu MenuStrip
MenuItem ToolstripMenuItem

Yes, this is an unfortunate breaking change. You will see build breaks if you are using the controls we removed in your applications. Also, if you open .NET Core 3.0 applications in the latest versions of the .NET Core Windows Forms designer, you will see errors if you are using these controls.

We recommend you update your applications to .NET Core 3.1 and move to the alternative controls. Replacing the controls is a straight-forward process, essentially “find and replace”.

First, we should have made these changes before we released .NET Core 3.0, and we appologize for that. We try to avoid late changes, and even more for breaking changes, and it pains us to make this one.

As we got further into the Windows Forms designer project, we realized that these controls were not aligned with creating modern applications and should never have been part of the .NET Core port of Windows Forms. We also saw that they would require more time from us to support than made sense.

Our goal is to continue to improve Windows Forms for high DPI, accessibility, and reliability, and this late change was required to enable us to focus on delivering that.
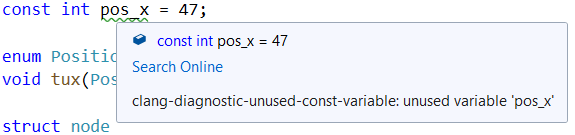
C++/CLI

We added support for creating C++/CLI (AKA “managed C++”) components that can be used with .NET Core 3.0+, in Visual Studio 2019 16.4. You need to install the “Desktop development with C++” workload and the “C++/CLI support” component in order to use C++/CLI.

This component adds a couple templates that you can use:

  • CLR Class Library (.NET Core)
  • CLR Empty Project (.NET Core)

If you cannot find them, just search for them in the New Project dialog.

C++/CLI is only enabled on Windows. You cannot use C++/CLI components targeted for .NET Framework with .NET Core or vice versa.

Closing

We recommend moving to .NET Core 3.1 as soon as you can. It is a great release (largely due to 3.0) that brings improvements to so many aspects of .NET Core. It is also a long term support (LTS) release, and will be supported for three years.

Life cycle update:

  • .NET Core 3.0 will reach end-of-life three months from today, on March 3, 2020.
  • .NET Core 2.2 will each end of life on December 23rd.
  • .NET Core 2.1 will be supported until August 2021 (it is also an LTS release).

The following .NET Core posts are recommended reading to learn more about what you get with .NET Core 3.1 and other projects we’ve been working on.

Fundamentals

Desktop

ASP.NET

General

The post Announcing .NET Core 3.1 appeared first on .NET Blog.


‘Tis the Season for the Visual Studio 2019 v16.4 Release

$
0
0
Giving Tree
Giving Tree on Microsoft Campus

Here in Redmond, glimpses of holiday cheer are filling our campus buildings as the season shifts to twinkling lights and frosty temperatures The Visual Studio team is seizing this time as an opportunity to celebrate the comradery needed to respond to developer needs and suggestions. Equally, we are reflecting over what we can improve in the upcoming year as well as plan product features to deliver.

What is more notable is the generosity flowing within our various Microsoft locations. One primary means of meeting community needs is through our annual Giving Tree program. There are festive trees in every building decorated with ornaments of wish list items for a variety of charitable organizations.  Teams and individuals are able to pick favorite tag item and gift them. To increase the impact, Microsoft matches the dollar amount for an additional gift to the charity! With giving in mind, we are anticipating this release of Visual Studio 2019 version 16.4 will fill your wish list item of a more stable, productive development environment. Since we started working on this release in August, we have implemented hundreds Developer Community suggestions and bug fixes.  Let’s take a look at what you’ll find in this release.


GitHub publishing directly from Team Explorer

We know GitHub integration brings value to your developer experience.  Therefore, we are excited to announce a previous extension making its way into the Visual Studio 2019 product. The ability to have GitHub publishing done directly from Team Explorer has been a favorite because of its seamless communication with GitHub repositories.  For this reason, local repositories can be synchronized by clicking the Publish to GitHub button on the Team Explorer Synchronization page.  This functionality has been a high priority of our teams, so we are eager to hear what you think.

Publish to GitHub from Visual Studio 2019 v16.4


XAML Hot Reload for Xamarin.Forms

Next, XAML Hot Reload for Xamarin.Forms enables you to make changes to your XAML UI and see them reflected live without requiring another build and deploy. This feature significantly speeds up development to make it easier to build, experiment, and iterate on your user interface. Best of all is how much time you can save since you no longer have to rebuild your application for every tweak.

Because your application is compiled using XAML Hot Reload, it works with all libraries and third-party controls, and is available for iOS and Android. Consequently, it works on all valid deployment targets including simulators, emulators, and physical devices. In the event that you are more curious, check out the XAML Hot Reload for Xamarin.Forms documentation detailed by the team members themselves.


Container Tools window

Another addition that started out as an extension in the Visual Studio Marketplace is the Container Tools window. This new tool window enables you to list, inspect, stop, start, and remove Docker images and containers on a local machine. As a result, you can view folders and files in running containers and open a terminal window.

Container Tools Window in Visual Studio 2019 v16.4
Container Tools Window in Visual Studio v16.4


XAML tooling improvements for WPF and UWP desktop developers

Furthermore, we are continuing to invest in productivity improvements for desktop developers building WPF and UWP applications. New features include IntelliSense support for XAML snippets, a “Just My XAML” filter for the Live Visual Tree, and a merge resource dictionary feature. Also included, is the ability to pop up the code editor view separate from the XAML designer.


Pinnable Properties Tool

We are continuing to improve debugging capabilities in this release. With this in mind, we are delighted to announce how identifying objects by their properties while debugging has just become easier and more discoverable with the new Pinnable Properties tool. In short, hover the cursor over a property you want to display in the debugger of the Watch, Autos, and Locals windows.  Click the pin icon. Next, you will see the information you are looking for at the top of your display!

Pin Properties in Debugger in Visual Studio 2019 v16.4
Pin Properties in Debugger shown in Visual Studio 2019 v16.4


Additionally, to help make debugging asynchronous code easier, we have added new features to Parallel Stacks for Tasks, a window that visualizes Tasks in .NET.


.NET Productivity

We added the new Go To Base command to navigate up the inheritance chain. The Go To Base command is available on the context (right-click) menu or you can type (Alt+Home) on the element you want to navigate through the inheritance hierarchy.

Go To Base Command in Visual Studio 2019 v16.4
Go To Base Command shown in Visual Studio 2019 v16.4


Also, you can configure the severity level of a code style rule directly through the editor. Place your cursor on the error, warning, or suggestion and type (Ctrl+.) to open the Quick Actions and Refactorings menu. Next, select ‘Configure or Suppress issues’. Finally, select the rule and choose the severity level you would like to configure. This will update your existing EditorConfig with the rule’s new severity. If you do not currently have an .editorconfig file, one will be automatically generated.


Vertical Tabs in Preview

Ever find yourself needing to see more of your document tabs or more lines of code? Now you can take advantage of the horizontal real estate of your widescreen monitors by using vertical document tabs.  To learn how to preview this feature, the details are in the vertical document tabs blog.

Vertical Tabs in Visual Studio 2019 v16.4


C++ Tooling

We have made three major improvements in the C++ development experience: the Clang-tidy integration in the editor, Address Sanitizer experimental support, and C++ Build Insights support for the MSVC compiler toolset. In addition to the improvements outlined below, this release also brings C++/CLI support in .NET Core 3.1 and several new enhancements to the CMake integration.  These include debug target selection, overview pages and easier customization of environment variables.

Clang-tidy Integration

C++ Code Analysis now natively supports Clang-Tidy for both MSBuild and CMake projects, whether you’re using a Clang or MSVC toolset. clang-tidy checks can run as part of background code analysis, appear as in-editor warnings (squiggles), and display in the Error List.

Clang-Tidy Integration in Visual Studio 2019 v16.4
Clang-Tidy integration in Visual Studio 2019 v16.4


Address Sanitizer support in MSVC (experimental)

You can now enable Address Sanitizer (ASAN) for your Windows C++ projects compiled with MSVC Compiler toolset. ASAN is a fast memory error detector that can find runtime memory issues such as use-after-free and perform out of bounds checks. This support is still experimental as we are actively working on further improving support in upcoming updates.

Address Sanitizer support in MSVC (Experimental) in Visual Studio 2019 v16.4
Visual Studio 2019 v16.4 Experimental Address Sanitizer support in MSVC

C++ Build Insights

You also have access to a collection of ETW-based tools that allow you to analyze your C++ builds and make decisions tailored to your own build scenarios. Consequently, there should be improvements to your build times. To learn more, check out the first in a series of blogposts on this topic: Introducing C++ Build Insights.

C++ Build Insights
C++ Build Insights Demonstration in Visual Studio 2019 v16.4


Visual Studio now supports “FIPS compliance mode”

Starting with version 16.4, Visual Studio 2019 now supports “FIPS 140-2 compliance mode” when developing apps and solutions for Windows, Azure, and .NET.  As an important note, there are some scenarios which may not use FIPS 140-2 approved algorithms.  These include developing apps or solutions for non-Microsoft platforms like Linux, iOS, or Android as well as third-party software included with Visual Studio or extensions that you choose to install. Finally, development for SharePoint solutions does not support FIPS 140-2 compliance mode.

To configure FIPS 140-2 compliance mode for Visual Studio, install .NET Framework 4.8 and enable the Windows group policy setting: “System cryptography: Use FIPS compliant algorithms for encryption, hashing, and signing.”


Extended support for Visual Studio 2019 version 16.4

Visual Studio 2019 version 16.4 is the second supported servicing baseline for Visual Studio 2019. Consequently, Enterprise and Professional customers needing to adopt a long term stable and secure development environment are encouraged to standardize on this version.  As explained in more detail in our lifecycle and support policy, version 16.4 will be supported with fixes and security updates for one year after the release of the next servicing baseline.

In addition, now that version 16.4 is available, version 16.0, our last released servicing baseline, will be supported for an additional 12 months. It will go out of support in January 2021. Note as well, versions 16.1, 16.2, and 16.3 are no longer under support. These intermediary releases received servicing fixes only until the next minor update released.

You can acquire the latest most secure version of Visual Studio 2019 version 16.4 in the downloads section of my.visualstudio.com.  For more information about Visual Studio supported baselines, please review the support policy for Visual Studio 2019.


End of Support reminders for prior versions of Visual Studio and Expression 4

The following products are nearing their end of support lifetime, which means that we will no longer be issuing security updates for these products.  These dates are all available on the Microsoft Lifecycle Policy site.

  • Visual Studio 2017 version 15.0 – support ends on Jan 14, 2020
  • Visual Studio 2010 suite of products – support ends on July 14, 2020
  • Expression 4 suite of products – support ends on Oct 13, 2020


Happy Developing into the New Year!

In whatever way you celebrate the season and the new year, we hope these features will keep you producing your best projects until the time comes to unplug and enjoy the festivities. We love to hear inspiring ideas of ways to improve Visual Studio 2019. Please take all questions and suggestions to Developer Community as this is where teams interact the most. Thank you for all you do to contribute to the community, and we wish you all of the best!

The post ‘Tis the Season for the Visual Studio 2019 v16.4 Release appeared first on Visual Studio Blog.

ASP.NET Core updates in .NET Core 3.1

$
0
0

ASP.NET Core updates in .NET Core 3.1

.NET Core 3.1 is now available and is ready for production use! .NET Core 3.1 is a Long Term Support (LTS) release.

Here’s what’s new in this release for ASP.NET Core:

  • Partial class support for Razor components
  • Pass parameters to top-level components
  • New component tag helper
  • Prevent default actions for events in Blazor apps
  • Stop event propagation in Blazor apps
  • Detailed errors during Blazor app development
  • Support for shared queues in HttpSysServer
  • Breaking changes for SameSite cookies

You can find all the details about these new features in the What’s new in ASP.NET Core 3.1 topic.

See the release notes for additional details and known issues.

Get started

To get started with ASP.NET Core in .NET Core 3.1 install the .NET Core 3.1 SDK.

If you’re on Windows using Visual Studio, install Visual Studio 2019 16.4. Installing Visual Studio 2019 16.4 will also install .NET Core 3.1, so you don’t need to separately install it.

Upgrade an existing project

To upgrade an existing ASP.NET Core app to .NET Core 3.0, follow the migrations steps in the ASP.NET Core docs.

See the full list of breaking changes in ASP.NET Core 3.1.

To upgrade an existing ASP.NET Core 3.0 RC1 project to 3.0:

  • Update all Microsoft.AspNetCore.* and Microsoft.Extensions.* package references to 3.1.0

That’s it! You should now be all set to use .NET Core 3.1!

Blazor WebAssembly update

Alongside this .NET Core 3.1 release, we’ve also released a Blazor WebAssembly update. Blazor WebAssembly is still in preview and is not part of the .NET Core 3.1 release. Blazor WebAssembly will ship as a stable release at a future date.

To install the latest Blazor WebAssembly template run the following command:

dotnet new -i Microsoft.AspNetCore.Blazor.Templates::3.1.0-preview4.19579.2

This release of Blazor WebAssembly includes a number of new features and improvements:

  • .NET Standard 2.1 support
  • Support for static assets in when publishing
  • iOS 13 support
  • Better linker errors
  • Attach to process debugging from Visual Studio

.NET Standard 2.1 support

Blazor WebAssembly apps now target .NET Standard 2.1 by default. Using .NET Standard 2.1 libraries from a Blazor WebAssembly app is now supported within the limits of the browser security sandbox.

Support for static assets in libraries when publishing

Standalone Blazor WebAssembly apps now support static assets from Razor class libraries both during development and when publishing. This applies to both standalone Blazor WebAssembly apps and ASP.NET Core hosted apps. Static assets are consumed from referenced libraries using the path prefix: _content/{LIBRARY NAME}/.

iOS 13 support

Blazor WebAssembly apps now work from iOS 13 based devices. The .NET IL interpreter now uses a non-recursive implementation to prevent exceeding the size of the stack on these devices.

Better linker errors

The IL linker is now integrated with Blazor WebAssembly projects such that linker are surfaced as build errors.

Attach to process debugging from Visual Studio

You can now debug Blazor WebAssembly apps from Visual Studio by attaching to the browser process. Currently this experience is very manual. In a future update, we expect to enable Visual Studio to handle all of the necessary wire-up to debug a Blazor WebAssembly app when you hit F5. Also, various features of the debugging experience (like viewing locals) are not yet enabled. This is something we will be working on over the next few months.

To debug a running Blazor WebAssembly app from Visual Studio:

  1. Run the app without debugging (Ctrl-F5 instead of F5)
  2. Open the Debug properties of the app and copy the HTTP app URL
  3. Browse to the HTTP address (not the HTTPS address) of the app using a Chromium based browser (Edge Beta or Chrome).
  4. With the browser in focus, press Shift-Alt-D and then follow the instructions to open a browser with remote debugging enabled
  5. Close all other browser instances
  6. In Visual Studio, select Debug > Attach to Process.
  7. For the Connection type, select Chrome devtools protocol websocket (no authentication).
  8. For the Connection target, paste in the HTTP address (not the HTTPS address) of the app and press Enter (don’t click “Find” – that does something else).
  9. Select the browser process you want to debug and select Attach
  10. In the Select Code Type dialog, select the code type for the specific browser you are attaching to (Edge or Chrome) and then select OK
  11. Set a break point in your app (for example, in the IncrementCount method in the Counter component) and then use that part of the app to hit the breakpoint.

Give feedback

We hope you enjoy this release of ASP.NET Core in .NET Core 3.1! We are eager to hear about your experiences with this latest .NET Core release. Let us know what you think by filing issues on GitHub.

Thanks for trying out ASP.NET Core!

The post ASP.NET Core updates in .NET Core 3.1 appeared first on ASP.NET Blog.

Announcing Entity Framework Core 3.1 and Entity Framework 6.4

$
0
0

Announcing Entity Framework Core 3.1 and Entity Framework 6.4

We are excited to announce the general availability of EF Core 3.1 and EF 6.4 on nuget.org.

The final versions of .NET Core 3.1 and ASP.NET Core 3.1 are also available now.

How to get EF Core 3.1

EF Core 3.1 is distributed exclusively as a set of NuGet packages. For example, to add the SQL Server provider to your project, you can use the following command using the dotnet tool:

dotnet add package Microsoft.EntityFrameworkCore.SqlServer --version 3.1.0

When upgrading applications that target older versions of ASP.NET Core to 3.1, you may also have to add the EF Core packages as an explicit dependency.

Starting in 3.0 and continuing for 3.1, the dotnet ef command-line tool is no longer included in the .NET Core SDK. Before you can execute EF Core migration or scaffolding commands, you’ll have to install this package as either a global or local tool. To install the final version of our 3.1.0 tool as a global tool, use the following command:

dotnet tool install --global dotnet-ef --version 3.1.0

It’s possible to use this new version of dotnet ef with projects that use older versions of the EF Core runtime. However, older versions of the tool will not work with EF Core 3.1.

What’s new in EF Core 3.1

The primary goal of EF Core 3.1 is to polish the features and scenarios we delivered in EF Core 3.0. EF Core 3.1 will be a long term support (LTS) release, supported for at least 3 years. To this end we have fixed over 150 issues for the 3.1 release, but there are no major new features to announce.

EF Core 3.1 reintroduces support for .NET Standard 2.0, rather than requiring .NET Standard 2.1 as was the case for EF Core 3.0. This means EF Core 3.1 will run on .NET Framework versions that support the standard.

What’s new in EF 6.4

Similar to EF Core, the primary goal of EF 6.4 is to polish the features and scenarios we delivered in EF 6.3. To this end we have fixed important issues found in EF 6.3 to create a more stable release.

What’s next

Planning for the EF Core “5.0” release (i.e. the one after 3.1) has started and we are making good progress. We will have something to share on GitHub soon.

Thank you

A big thank you to the following community contributors to EF Core and EF6 as part of this release.

@breyed
@chrfin
@crowet
@EricStG
@guftall
@gurmeetsinghdke
@ite-klass
@jfoshee
@jtheisen
@mistachkin
@morrisjdev
@OOberoi
@pacoweb
@pmiddleton
@Psypher9
@ptjhuang
@riccikl
@ronnelsantiago
@skalpin
@StefH
@vanillajonathan
@Youssef1313

Documentation and feedback

The starting point for all Entity Framework documentation is https://docs.microsoft.com/ef/.

Please file issues found and any other feedback on GitHub for EF Core or EF6.

The post Announcing Entity Framework Core 3.1 and Entity Framework 6.4 appeared first on .NET Blog.

What’s new in XAML developer tools in Visual Studio 2019 for WPF & UWP

$
0
0

Since the launch of Visual Studio 2019 we’ve released many new features for XAML developers working on WPF or UWP desktop applications. With this week’s release of Visual Studio 2019 version 16.4 and 16.5 Preview 1 we’d like to use this opportunity to do a recap of what’s new throughout the year. If you missed our previous releases or simply have not had a chance to catch-up, this blog post will be the one place where you can see every major improvement we’ve made throughout 2019.

XAML Live Debugging Tools:

  • XAML C# Edit & Continue is now known as XAML Hot Reload (v16.2): XAML C# edit & continue for WPF/UWP customers is now known as XAML Hot Reload, this new name is intended to be better aligned with how the feature actually works (since no pause is required after a XAML edit is made) and match the similar functionality in Xamarin.Forms.
  • XAML Hot Reload available/unavailable (v16.2): The in-app toolbar has been updated to indicate if XAML Hot Reload is available/unavailable and link to the related documentation. Before this improvement customers had no way to know if XAML Hot Reload was working without trying to first use the feature, which was leading to confusion.
  • In-app toolbar now themed (v16.2): The in-app toolbar is now styled according to the Visual Studio selected theme colors.
In-app toolbar now themed (v16.2)


  • In-app toolbar element selection behavior changes: We’ve updated the behavior of the in-app toolbar feature “Enable selection” for selecting elements within the running app. With this change the selector will stop selecting elements after you have selected your first element. This brings it in line with similar tools such as F12 browser tools and is based on customer feedback.
  • XAML Hot Reload now supports x:bind (UWP) – v16.0: XAML Hot Reload (previous called “XAML Edit & Continue”) now supports editing data bindings created with x:bind for paths containing public properties, element name, indexed property paths (collections), attached properties, and cast properties. Other changes are not supported. This enhancement is available to any app where the minimum and maximum versions target Windows 10 SDK version 1809 (build 10.0.17763) or higher.
  • XAML Hot Reload support added for WPF resource dictionaries changes (v16.3): XAML Hot Reload now supports updating WPF Resource Dictionaries for real-time updates in the application. Previously this feature was only available to Universal Windows Platform (UWP), but is now supported for WPF .NET Framework, WPF .NET Core and UWP apps. Supported actions include adding a new Resources section definition and adding, deleting and updating resources new/existing sections.
  • Just My XAML in Live Visual Tree: The Live Visual Tree is a feature that is available to both UWP and WPF developers when they run their application in debug mode and is part of the live editing tooling related to XAML Hot Reload. Previously the feature would display the full live visual tree of the attached running application with no filter possible to see just the XAML you’ve written in your app. This made for a very noisy experience and based on customer feedback we’ve added a new default called “Just My XAML” which will limit the tree to just controls you wrote in your application. While this is the new default it is still possible to go back to the previous behavior through either the button within the Live Visual Tree itself or through a new setting (found under: Options > Debugging > General > Enable Just My XAML).
Just My XAML in Live Visual Tree


  • In-app toolbar now movable (v16.3): The in-app toolbar has been enhanced so that it is movable within the running WPF/UWP application, enabling developers to drag it left or right within the app to unblock app UI. Note that position to which the toolbar is moved is not stored between sessions and will go back to the default position when your app is restarted.
In-app toolbar now movable (v16.3)


  • XAML Binding Failures panel (standalone VSIX early alpha preview): To help developers when data binding failures occur in their application, we’ve got a new feature in development that brings a dedicated XAML Binding Failures panel to visual studio. While this feature will eventually work for all XAML developers (WPF, UWP and Xamarin.Forms) in this first preview the new panel will make it easier to identify binding failures for those customers building WPF application.
XAML Binding Failures panel (standalone VSIX early alpha preview)


This feature means that developers will no longer have to use the output window to detect binding failures and make them more discoverable to newer developers.

This feature is still very early in development and not included in Visual Studio, if you wish to start testing it today you can do so by downloading our alpha VSIX.

XAML Designer

  • WPF Designer now fully available (GA) for WPF .NET Core Projects (v16.3): The XAML Designer for WPF .NET Core applications is now generally available (GA) to all customers without the need for preview feature flag. The XAML Designer for WPF .NET Core applications is slightly different in some behaviors and functionality then WPF .NET Framework Designer, please note this is by design. Given the difference we’d like to encourage customers to report any problems or limitations that you might be running into using Visual Studio feedback feature.
WPF Designer now fully available (GA) for WPF .NET Core Projects (v16.3)


  • XAML Designer zoom/position now defaults to Fit All (v16.4): Based on customer feedback we’ve reevaluated the default XAML Designer zoom behavior that occurs when you open a XAML window/page/control/etc. The previous experienced stored the zoom level and position for each file across Visual Studio sessions which caused confusion when customers were coming back to a file after some time had passed. Starting with this release we will only store the zoom level and position for the duration of the active session and go back to a “fit all” default once Visual Studio is restarted.
  • Create Data Binding Dialog (v16.4): Visual Studio has had a data binding dialog available to WPF .NET Framework developers from the right-click of the XAML Designer and Property Explorer, and this dialog was also previously available to UWP developers. In this release we’re bringing back this experience to UWP developers and adding support for WPF .NET Core applications. This feature is still in development and will continue to improve in the future to bring back feature parity with .NET Framework dialog capabilities.
  • XAML Designer Suggested Actions (v16.5 Preview): In this release we’ve made available a new preview featured called Suggested Actions that enables easy access to common properties when a control is selected within the XAML Designer. To use this feature first enable it through Options > Preview Features > XAML Suggested Actions. Once enabled click on a supported control and use the lightbulb to expand and interact with the Suggestion Actions UI. In this release supported controls include: Border, Button, Canvas, CheckBox, ComboBox, Grid, Image, Label, ListBox, ListView, StackPanel, TextBlock, TextBox. While in preview this feature is also only available for WPF .NET Core applications and doesn’t support extensibility, nor is it feature complete.
XAML Designer Suggested Actions (v16.5 Preview)


(Please note that this feature is under active development and might change significantly before final release, so your feedback is crucial, and we hope to hear from you through the Visual Studio feedback tool.)

XAML Editor

  • IntelliCode Support for XAML (v16.0): IntelliCode is an AI-assisted IntelliSense for multiple languages that predicts the most likely correct API for the developer to use instead of just an alphabetical list of members. IntelliCode supports languages such as C#, C++, XAML and others.
  • Improvements to #regions IntelliSense (v16.4): Starting with Visual Studio 2015 #region support has been available for WPF and UWP XAML developers and more recently for Xamarin.Forms. In this release we’ve fixed an IntelliSense bug, with this fix #regions will now show properly as you begin to type <!.
  • Snippets in XAML IntelliSense (v16.4): IntelliSense has been enhanced to support showing XAML snippets, this will work for both built-in snippets and any custom snippets that you add manually. Starting with this release we’re also including some out-of-the-box XAML snippets: #region, Column definition, Row definition, Setter and Tag.
  • Pop up XAML editor as a separate window from designer (v16.4): It is now possible to easily split the XAML Designer and its underlying XAML editor into separate windows using the new Pop up XAML button next to the XAML tab. When clicked the XAML designer will minimize its attached XAML tab and pop open a new window for just the XAML editor view. You can move this new window to any display or tab group in Visual Studio. Note that it is still possible to expand the original XAML view but regardless all XAML views of the same file will stay synchronized in real-time.
Pop up XAML editor as a separate window from designer (v16.4)


  • Displaying resources for referenced assemblies (v16.4): XAML IntelliSense has been updated to support displaying XAML resources from a referenced assembly (when source is not available) for WPF Framework and WPF .NET Core projects.

XAML Islands:

  • Improved XAML Island support (v16.4): We’ve added support for XAML Islands scenario for Windows Forms and WPF .NET Core 3 apps making it easier to add UWP XAML control into these applications. With these improvements a .NET Core 3 project can a reference to UWP project that contains custom UWP XAML controls. Those custom controls can be used by the WindowsXamlHost controls shipped within the Windows Community Toolkit v6 (Microsoft.Toolkit.Wpf.UI.XamlHost v6.0). You can also use the Windows Application Packaging project to generates MSIX for you .NET Core 3 with Islands. To learn how to get started visit our documentation.

Resources & Templates

  • Merge Resource Dictionary:It is now possible to easily merge an existing resource dictionary within your UWP/WPF project with any valid XAML file using the new feature available through the solution explorer. Simply open the XAML file in which you want to add the merge statement, then find the file you wish to merge in and right-click on it in solution explorer. In the context menu select the option “Merge Resource Dictionary Into Active Window”, which will add the right merge XAML with path.
Merge Resource Dictionary


  • Edit Template now works with controls from 3rd party controls: It is now possible to create a copy of a controls template even when it’s not part of your solution as source code. With this change the “Edit Template” feature will now be available and work as it does for 1st party elements where the source is available today. Note that this feature is applicable to both 3rd party control libraries and 1st party where source isn’t available.

Packaging and Signing

  • Signing Certificates for UWP apps (v16.3): Brought back the ability to create and import signing certificate files (.pfx) through the Manifest Designer. We’ve also introduced the ability to create and import signing certificates through the Packaging Wizard to streamline the signing process.
Signing Certificates for UWP apps (v16.3)


Related News

Recently there were also other announcements that are relevant to desktop developers, if you missed any of these here is a consolidated list for your consideration:

  • Visual Studio App Center now support .NET desktop applications including WinForms, WPF and UWP. This includes apps powered by .NET Framework or .NET Core and supported features include deployment, health monitoring (crash reporting) and real-time insights (custom telemetry). For full details check out their recent blog post.
  • Windows has announced WinUI 3, with both the alpha release and long-term roadmap announced. With WinUI 3 developers will be able to use the power of modern XAML to build both desktop and UWP applications powered by .NET Core or C++. To learn all the details see their roadmap.
  • Windows UI Library 2.3 is now available, which continues to add more controls for UWP developers. For all the details see their release notes.
  • Ignite 2019 XAML conference sessions are now available as free on-demand videos, if you missed Ignite this year their worth checking out.

Conclusion

These features are also just some of the things we’ve been working on, with many more still in development and we hope to share more information with you when their ready.

For now, please keep your feedback coming as many of the above items were created based on customer input, as your input is a critical part of how we improve Visual Studio.

Finally, you can also see demos for many of the above features in our latest Visual Studio Toolbox video:

Pinnable Properties: Debug & Display Managed Objects YOUR Way

$
0
0

A few months ago, I wrote a blog post about the DebuggerDisplay attribute. This is a managed attribute that lets you customize how you view objects in debugging windows by “favoriting” specific properties. Since that post, we’ve streamlined DebuggerDisplay’s behavior with Pinnable Properties, a new managed feature available for Visual Studio 16.4!

Native developers: Fear not, Pinnable Properties will also be available for C++ in a later update!


Pinning a property in the Locals window
Pinning a property


How does the Pinnable Properties tool work?

The Pinnable Properties tool is located in DataTips and the Autos, Locals, and Watch windows at debug time. To use the tool, hover over a property and select the toggle-able pin icon that appears or select the “Pin Member as Favorite” option in the context menu. You will immediately see your selected members bubble to the top of your property list and appear in the Values column of any of the debugger inspection windows, replacing the default object type that is typically displayed. Now you can quickly identify and scan through your countless objects, greatly increasing your productivity.


Pinning properties in DataTips


The properties you pin will persist across all your future debugging sessions until you decide to unpin them. Also, you can filter unpinned properties and hide property names via the Watch window toolbar or a DataTip context menu.


Filter out unpinned properties


Toggle property names on and off with pinned properties
Toggle pinned property names


Why does the Pinnable Properties tool exist?

Your feedback determined that there was high demand for quickly identifying objects in debugger windows via specific properties. Though DebuggerDisplay and Natvis can accomplish this task, they have several drawbacks that we observed and learned from you and other developers, including:

  • having to modify your code to use the attribute
  • the inability to use the attribute dynamically at debug time
  • the lack of discoverability (I have been asked many times if DebuggerDisplay is a Visual Studio 2019 exclusive feature when it’s been out for many, many years now…)

We created the Pinnable Properties tool to reduce these issues and provide with you with an easier, more intuitive, and real-time method to customize your object inspection experience without having to modify your code or override your ToString() method.


Try out Pinnable Properties and give us even more feedback!

Pinnable Properties would not have been possible without your enthusiasm and feedback for improving the existing DebuggerDisplay and Natvis behavior.  We encourage you to try it out and share your thoughts on how we can make this tool even better in the comments or via this survey!

Updates to .NET Core Windows Forms designer in Visual Studio 16.5 Preview 1

$
0
0

We are happy to announce the new preview version of the .NET Core Windows Forms designer, which is available with the Visual Studio 16.5 Preview 1.

The big news is that the designer is now part of Visual Studio! This means that installing the .NET Core Windows Forms designer from a separate VSIX is no longer needed!

To use the designer:

  • You must be using Visual Studio 16.5 Preview 1 or a later version.
  • You need to enable the designer in Visual Studio. Go to Tools > Options > Environment > Preview Features and select the Use the preview Windows Forms designer for .NET Core apps option.

If you haven’t enabled the Windows Forms designer, you might notice a yellow bar in the upper part of your Visual Studio Preview suggesting you to enable it:

Selecting the Enable link takes you to the same place in Tools > Options > Environment > Preview Features where you can enable the Windows Forms .NET Core designer preview.

What’s new

In this preview version of the designer, we’ve improved reliability and enhanced performance, fixed many bugs, and added the following features:

  • Designer Actions for available controls, such as making a TextBox multiline or adding items to a CheckedListBox.
  • Improved Undo/Redo actions to prevent hangs or incomplete undos.
  • Scrollbars now appear when the form is larger than the visible document window and on Forms with the AutoScroll property set to True and controls outside the visible area of the form.
  • Added GroupBox and Panel container control support.
  • Copy-paste is supported between container controls.
  • Limited Component Tray support.
  • Local resources support.
  • Timer control support.

Features currently under development

Support for the following features is currently on our backlog and being actively addressed:

  • Localization of your own Windows Forms applications.
  • Data-related scenarios including data binding and data-related controls.
  • Document Outline Window.
  • The remaining container controls.
  • MenuStrip and ToolStrip are expected in the next preview.
  • Third-party controls and UserControls.
  • Inherited Forms and UserControls.
  • Tab Order.
  • Tools > Options page for the designer.

Upgrade to .NET Core 3.1

We recommend that you upgrade your applications to .NET Core 3.1 before using the Windows Forms .NET Core designer. Visual Studio may not perform as expected if your project is targeting an earlier version of .NET Core.

In .NET Core 3.1 a few outdated Windows Forms controls (DataGrid, ToolBar, ContextMenu, Menu, MainMenu, MenuItem, and their child components) were removed. These controls were replaced with newer and more powerful ones in .NET Framework 2.0 in 2005 and haven’t been available by default in the designer Toolbox. Moving forward with .NET Core, we had to cut them out of the runtime as well in order to maintain support for areas like high DPI, accessibility, and reliability. For more information please see the announcement blog post.

Under the hood of the new Windows Forms Core designer (or why it takes us so much time)

We know that you’ve noticed: although the Windows Forms .NET Core designer Preview has basic functionalities, it is not mature enough for providing the full Windows Forms experience and we need a little more time to get there. In this chapter we wanted to give you a glimpse into how we are implementing the designer for .NET Core and explain some of the time frames.

The concept

Visual Studio is based on .NET Framework. The Windows Forms Core designer however should enable users to create a visual design for .NET Core apps. If you’ve tried to “mix” .NET Framework and .NET Core projects, you probably know what the challenge is here: .NET Core assemblies cannot be integrated into .NET Framework projects. Because of this (and some other reasons that we don’t want to overwhelm you with), we came up with the following internal concept: whenever the .NET Core designer is started (for example, by double-clicking on a form), a second designer process starts under the hood almost independently of Visual Studio. And that process takes over the .NET Core design part, or better to say – it’s responsible for instantiating the .NET Core based objects that are then rendered on the monitor by the .NET Core process and not the Visual Studio process.

For example, when you drag a Button from the Toolbox onto a form – this action is handled by Visual Studio (devenv.exe process which is .NET Framework). But, once you release the mouse button to drop the Button on the form, all further actions (instantiating a Button, rendering it at a specific location, and so on) are related to .NET Core. That means .NET Framework process can no longer handle it. Instead it calls to a .NET Core process which does the job and also creates the user interface code at runtime, which lives in the InitializeComponent method of a Form or a UserControl. This is the same way the XAML designer works for UWP and .NET Core.

Was there a better way?

There was another approach we could take that would save us a lot of time. We could simply “map” the .NET Core objects, features, and so on to .NET Framework ones. But this approach has significant limitations. The new features, that are available only in .NET Core won’t be available in this “mapped” designer. And we already have quite a few Core-only functionalities such as: the new PlaceholderText property of the TextBox control, the new default font, that is used in Windows Forms .NET Core. And going forward we expect more innovations coming.

That’s why we turned down that idea, and proceeded with the described above “out-of-process approach” that handles new additions to .NET Core very well.

This is how it works

The Property Browser in Visual Studio is based on the .NET Framework. However, thanks to TypeDescriptors, we can create “proxy objects” as a communication link between the two processes at design time to access the actual .NET Core objects in the other (.NET Core) process via inter-process communication. That way, even though the UI is still in Visual Studio and thus is .NET Framework, users will see and edit every single aspect of the Windows Forms .NET Core objects’ functionality.

The downside of this approach is that it requires us to rewrite significant portions of the Framework Windows Forms designer. To do this correctly, with the performance and stability that you expect, we had to set out a significant amount of time. The XAML designer team already developed an out-of-process model for UWP XAML designer support when UWP implemented .NET Standard 2.0. They were able to share much of that architecture with WPF running against .NET Core. This gave a head-start for .NET Core WPF designer, and now it is released and ready for .NET Core developers. The Windows Forms team started working on the designer with the .NET Core 3.0 announcement. We expect to get to feature parity by May 2020, and complete the work by the end of 2020.

The Windows Forms team wants to say THANK YOU! to those who are already testing preview versions of the designer and reporting issues! We know the experience may not be stable and we appreciate your patience and your desire to help us! 🙂

How to report issues

Your feedback and help are important to us! Please report issues or feature requests via the Visual Studio Feedback channel. To do so, select the Send Feedback icon in Visual Studio top-right corner as shown in the following picture and specify that it is related to the “WinForms .NET Core” area.

.NET Core 2.2 will reach End of Life on December 23, 2019

$
0
0

.NET Core 2.2 was released on December 4, 2018. As a non-LTS (“Current”) release, it is supported for three months after the next release. .NET Core 3.0 was released on September 23, 2019. As a result, .NET Core 2.2 is supported until December 23, 2019.

After that time, .NET Core patch updates will no longer include updated packages of container images for .NET Core 2.2. You should plan your upgrade from .NET Core 2.2 now.

.NET Core 3.1 released December 3, 2019 as a Long-term support release. As a result, .NET Core 3.0, released September 23, 2019 is supported until March 23, 2020.

Upgrade to .NET Core 3.1

The supported upgrade path from .NET Core 2.2 is via .NET Core 3.1. Migrating from 2.2 to 3.1 is straightforward; update the project file to use 3.1 rather than 2.2. The first document below illustrates the process from 2.0 to 2.1. ASP.NET Core 2.2 to 3.1 has additional considerations detailed in the second document.

Microsoft Support Policy

Microsoft has a published support policy for .NET Core. It includes policies for two release types: LTS and Current.

  • LTS releases include features and components that have been stabilized, requiring few updates over a longer support release lifetime. These releases are a good choice for hosting applications that you do not intend to update often.
  • Current releases include features and components that are new and may undergo future change based on feedback. These releases are a good choice for applications in active development, giving you access to the latest features and improvements. You need to upgrade to later .NET Core releases more often to stay in support.

Both types of releases receive critical fixes throughout their lifecycle, for security, reliability, or to add support for new operating system versions. You must stay up-to-date with the latest patches to qualify for support.

See .NET Core Supported OS Lifecycle Policy to learn about Windows, macOS and Linux versions that are supported for each .NET Core release.


Microsoft has validated the Lenovo ThinkSystem SE350 edge server for Azure Stack HCI

$
0
0

Do you need rugged, compact-sized hyperconverged infrastructure (HCI) enabled servers to run your branch office and edge workloads? Do you want to modernize your applications and IoT functions with container technology? Do you want to leverage Azure's hybrid services such as backup, disaster recovery, update managment, monitoring, and security compliance?  

Microsoft and Lenovo have teamed up to validate the Lenovo ThinkSystem SE350 for Microsoft's Azure Stack HCI program. The ThinkSystem SE350 was designed and built with the unique requirements of edge servers in mind. It is versatile enough to stretch the limitations of server locations, providing a variety of connectivity and security options and can be easily managed with Lenovo XClarity Controller. The ThinkSystem SE350 solution has a focus on smart connectivity, business security, and manageability for the harsh environment. To see all Lenovo servers validated for Azure Stack HCI, see the Azure Stack HCI catalog to learn more.

Lenovo ThinkSystem SE350:

The ThinkSystem SE350 is the latest workhorse for the edge. Designed and built with the unique requirements for edge servers in mind, it is versatile enough to stretch the limitations of server locations, providing a variety of connectivity and security options and is easily managed with Lenovo XClarity Controller. The ThinkSystem SE350 is a rugged compact-sized edge solution with a focus on smart connectivity, business security, and manageability for the harsh environment.

The ThinkSystem SE350 is an Intel® Xeon® D processor-based server, with a 1U height, half-width and short depth case that can go anywhere. Mount it on a wall, stack it on a shelf, or install it in a rack. This rugged edge server can handle anything from 0-55°C as well as full performance in high dust and vibration environments.

Information availability is another challenging issue for users at the edge, who require insight into their operations at all times to ensure they are making the right decisions. The ThinkSystem SE350 is designed to provide several connectivity options with wired and secure wireless Wi-Fi and LTE connection ability. This purpose-built compact server is reliable for a wide variety of edge and IoT workloads.

Microsoft Azure Stack HCI:

Azure Stack HCI solutions bring together highly virtualized compute, storage, and networking on industry-standard x86 servers and components. Combining resources in the same cluster makes it easier for you to deploy, manage, and scale. Manage with your choice of command-line automation or Windows Admin Center.

Achieve industry-leading virtual machine (VM) performance for your server applications with Hyper-V, the foundational hypervisor technology of the Microsoft cloud, and Storage Spaces Direct technology with built-in support for non-volatile memory express (NVMe), persistent memory, and remote direct memory access (RDMA) networking.

Help keep apps and data secure with shielded virtual machines, network micro-segmentation, and native encryption.

You can take advantage of cloud and on-premises working together with a hyper-converged infrastructure platform in the public cloud. Your team can start building cloud skills with built-in integration to Azure infrastructure management services:

  • Azure Site Recovery for high availability and disaster recovery as a service (DRaaS).

  • Azure Monitor, a centralized hub to track what’s happening across your applications, network, and infrastructure, with advanced analytics powered by artificial intelligence.

  • Cloud Witness, to use Azure as the lightweight tie-breaker for cluster quorum.

  • Azure Backup for offsite data protection and to protect against ransomware.

  • Azure Update Management for update assessment and update deployments for Windows Virtual Machines running in Azure and on-premises.

  • Azure Network Adapter to connect resources on-premises with your VMs in Azure via a point-to-site VPN.

  • Sync your file server with the cloud, using Azure File Sync.

  • Azure Arc for Servers to manage role-based access control, governance, and compliance policy from Azure Portal.

By deploying the Microsoft + Lenovo HCI solution, you can quickly solve your branch office and edge needs with high performance and resiliency while protecting your business assets by enabling the Azure hybrid services built into the Azure Stack HCI Branch office and edge solution.  

Soundscape app delivers the world in 3D sound with Bing Maps

$
0
0

Imagine being able to navigate through your neighborhood using your hearing alone. Microsoft Soundscape is an application built by the Enable Group in Microsoft Research that helps the blind and low vision explore the world around them using a map delivered in 3D sound. Armed with a stereo headset and the Soundscape app, anyone with a visual impairment can experience a mobile voice-based map that helps empower by providing the independence to traverse your environment and the ability to choose how to get from place to another.

With the help of Bing Maps Local Search and Bing Maps Location Recognition APIs, Soundscape enables you to hear where landmarks are around you to orient yourself, build a richer awareness of your surroundings, and have the confidence to discover what’s around the next corner.

Read the full story at https://www.microsoft.com/en-us/maps/customers/microsoft-soundscape.

Policy support to restrict creating new Azure DevOps organizations

$
0
0

We make it easy for users to create new organizations and start collaborating within seconds in Azure DevOps. While our users loved this, some of our big enterprise customers have long been demanding that they need to control who can create new organizations within their company as a way to protect their IP. With the latest sprint deployment, I am happy to announce that we rolled out a new policy in Azure DevOps to restrict this to a configured list of people in your company. This policy is supported only for company owned (Azure Active Directory) organizations. Users creating organization using their personal account (MSA or GitHub) have no restrictions.

To administer this policy, users need to be assigned to a new role called ‘Azure DevOps Administrator’ in Azure AD. Talk to the Azure AD administrator of your company to get this role assigned to you. Please refer to the documentation about this new role here.

You can find this role in the Azure Portal under Azure Active Directory > Roles and administrators.

Once you are assigned to this role, sign into any Azure DevOps organization that is connected to your Azure AD tenant to start managing this policy. You can find this new policy under organization settings > Azure Active Directory.

You can find the documentation to configure this policy here.

Please try out this feature and let us know your feedback through via Twitter on @AzureDevOps, or using Developer Community.

Top Stories from the Microsoft DevOps Community – 2019.12.06

$
0
0

This week, the emerging theme of the community posts is the cross-platform, cross-cloud, extensible nature of Azure DevOps. Azure DevOps is not just a product, but a platform, enabling the community to expand and improve on our engineering efforts to support the growing variety of technologies around the world.

Configure CI/CD in Azure DevOps
If you aren’t familiar with the Azure DevOps Project, it is an Azure resource that lets you deploy and configure a sample app to an Azure environment, and wire up CI/CD for it in Azure DevOps. The Azure DevOps Project supports multiple types of technologies and environments, making it easy to create a deployment prototype that you can use as a reference. In this post, Prakash Kumar shares a detailed walkthrough of configuring a Build and Release for a .NET Core app, using the Azure DevOps Project.

Azure DevOps and Multi-Cloud – Deploying .NET Core Apps in AWS and Azure using Azure DevOps
In this post, Abhijit Jana also starts with the Azure DevOps Project, but takes it a step further. In addition to deploying the .NET Core web app into Azure, Abhijit also deploys it to AWS Elastic Beanstalk, both using Azure DevOps. Now we have a multi-cloud solution!

How to build and sign your iOS application using Azure DevOps
In addition to being cross-cloud, Azure DevOps is also cross-platform! In this post, Damien Aicheh shows us an Azure Pipeline for building and signing your iOS application, producing a signed ipa. Thank you Damien!

Using Azure Pipelines to publish the NuGet package from GitHub repo
Of course, not all code is immediately deployed as an app – web, mobile or otherwise. In this blog, Xiaodi Yan shows us how to create an Azure YAML pipeline that publishes a NuGet package implementing a messenger component for WPF and Xamarin. Great work!

Introduction to the Red Hat OpenShift deployment extension for Microsoft Azure DevOps
And, of course, the true reason we can support so many languages, platforms and environments is that we work closely with our partners to extend the ecosystem. In this post, Luca Stocchi introduces us to the new version of the Azure DevOps extension for Red Hat OpenShift. With this extension, you can deploy to any OpenShift cluster from Azure DevOps. And the extension is open source, so you can contribute to the effort. Thanks for the hard work, Luca!

If you’ve written an article about Azure DevOps or find some great content about DevOps on Azure, please share it with the #AzureDevOps hashtag on Twitter!

Remote Debugging a .NET Core Linux app in WSL2 from Visual Studio on Windows

$
0
0

With Visual Studio Code and WSL (Windows Subsystem for Linux) you can be in a real Linux environment and run "code ." from the Linux prompt and Visual Studio Code will launch in Windows and effectively split in half. A VSCode-Server will run in Linux and manage the Language Services, Debugger, etc, while Windows runs your VS Code instance. You can use VS Code to develop on remote machines over SSH as well and it works great. In fact there's a whole series of Remote Tutorials to check out here.

VS Code is a great Code Editor but it's not a full IDE (Integrated Development Environment) so there's still lots of reasons for me to use and enjoy Visual Studio on Windows (or Mac).

I wanted to see if it's possible to do 'remote' debugging with WSL and Visual Studio (not Code) and if so, is it something YOU are interested in, Dear Reader.

  • To start, I've got WSL (specifically WSL2) on my Windows 10 machine. You can get WSL1 today on Windows from "windows features" just by adding it. You can get WSL2 today in the Windows Insiders "Slow Ring."
  • Then I've got the new Windows Terminal. Not needed for this, but it's awesome if you like the command line.
  • I've got Visual Studio 2019 Community

I'm also using .NET Core with C# for my platform and language of choice. I've installed from https://dot.net/ inside Ubuntu 18.04, under Windows. I've got a web app (dotnet new razor) that runs great in Linux now.

RemoteWebApp in the Terminal

From the WSL prompt within terminal, I can run "explorer.exe ." and it will launch Windows Explorer at the path \wsl$Ubuntu-18.04homescottremotewebapp, but VS currently has some issues opening projects across this network boundary. I'll instead put my stuff at c:tempremotewebapp and access it from Linux as /mnt/c/temp/remotewebapp.

RemoteWebApp in Explorer

In a perfect world - this is future speculation/brainstorming, Visual Studio would detect when you opened a project from a Linux path and "Do The Right Thing(tm)."

I'll need to make sure the VSDbg is installed in WSL/Linux first. That's done automatically with VS Code but I'll do it manually in one line like this:

curl -sSL https://aka.ms/getvsdbgsh | /bin/sh /dev/stdin -v latest -l ~/vsdbg

We'll need a launch.json file with enough information to launch the project, attach to it with the debugger, and notice when things have started. VS Code will make this for you. In some theoretical future Visual Studio would also detect the context and generate this file for you. Here's mine, I put it in .vs/launch.json in the project folder.

VS will make a launch.json also but you'll need to add the two most important parts, the $adapter and $adapterArgs part as I have here.

{

// Use IntelliSense to find out which attributes exist for C# debugging
// Use hover for the description of the existing attributes
// For further information visit https://github.com/OmniSharp/omnisharp-vscode/blob/master/debugger-launchjson.md
"version": "0.2.0",
"configurations": [
{
"$adapter": "C:\windows\sysnative\bash.exe",
"$adapterArgs": "-c ~/vsdbg/vsdbg",
"name": ".NET Core Launch (web)",
"type": "coreclr",
"request": "launch",
"preLaunchTask": "build",
// If you have changed target frameworks, make sure to update the program path.
"program": "/mnt/c/temp/remotewebapp/bin/Debug/netcoreapp3.0/remotewebapp.dll",
"args": [],
"cwd": "/mnt/c/temp/remotewebapp",
"stopAtEntry": false,
// Enable launching a web browser when ASP.NET Core starts. For more information: https://aka.ms/VSCode-CS-LaunchJson-WebBrowser
"serverReadyAction": {
"action": "openExternally",
"pattern": "^\s*Now listening on:\s+(https?://\S+)"
},
"env": {
"ASPNETCORE_ENVIRONMENT": "Development"
},
"sourceFileMap": {
"/Views": "${workspaceFolder}/Views"
},
"pipeTransport": {
"pipeCwd": "${workspaceRoot}",
"pipeProgram": "bash.exe",
"pipeArgs": [ "-c" ],
"debuggerPath": "~/vsdbg/vsdbg"
},
"logging": { "engineLogging": true }
}
]
}

These launch.json files are used by VS and VS Code and other stuff and give the system and debugger enough to go on. There's no way I know of to automate this next step and attach it to a button like "Start Debugging" - that would be new work in VS - but you can start it like this by calling a VS2019 automation command from the "Command Window" you can access with View | Other Windows | Command Window, or Ctrl-Alt-A.

Once I've typed this once in the Command Window, I can start the next Debug session by just pressing Up Arrow to get the command from history and hitting enter. Again, not perfect, but a start.

DebugAdapterHost.Launch /LaunchJson:C:tempremotewebapp.vslaunch.json  

Here's a screenshot of me debugging a .NET Core app running in Linux under WSL from Windows Visual Studio 2019.

VS 2019

Thanks to Andy Sterland for helping me get this working.

So, it's possible, but it's not falling-off-a-log automatic. Should this setup and prep be automatic? Is development in WSL from Visual Studio (not Code) something you want? There is great support for Docker development within a container including interactive debugging already, so where do you see this fitting in...if at all? Does this add something or is it more convenient? Would you like "F5" debugging for WSL apps within VS like you can in VS Code?


Sponsor: Like C#? We do too! That’s why we've developed a fast, smart, cross-platform .NET IDE which gives you even more coding power. Clever code analysis, rich code completion, instant search and navigation, an advanced debugger... With JetBrains Rider, everything you need is at your fingertips. Code C# at the speed of thought on Linux, Mac, or Windows. Try JetBrains Rider today!


© 2019 Scott Hanselman. All rights reserved.
     

Advice to my 20 year old self

$
0
0

A lovely interactionI had a lovely interaction on Twitter recently where a young person reached out to me over Twitter DM.

She said:

If you could go back and give your 20-something-year-old self some advice, what would you say?

I’m about to graduate and I’m sort of terrified to enter the real world, so I’ve sort of been asking everyone.

What a great question! Off the top of my head - while sitting on the tarmac waiting for takeoff and frantically thumb-typing - I offered this brainstorm.

First
Avoid drama. In relationships and friends
Discard negative people
There’s 8 billion people out there
You don’t have to be friends with them all
Don’t let anyone hold you back or down
We waste hours and days and years with negative people
Collect awesome people like Pokémon
Network your butt off. Talk to everyone nice
Make sure they aren’t transactional networkers
Nice people don’t keep score
They generously share their network
And ask for nothing in return but your professionalism
Don’t use a credit card and get into debt if you can
Whatever you want to buy you likely don’t need it
Get a laptop and an iPad and buy experiences
Don’t buy things. Avoid wanting things
Molecules are expensive
Electrons are basically free
If you can avoid want now, you’ll be happier later
None of us are getting out of this alive
And we don’t get to take any of the stuff
So ask yourself what do I want
What is happiness for you
And optimize your existence around that thing
Enjoy the simple. street food. Good friends
If you don’t want things then you’ll enjoy people of all types
Use a password system like
@1Password
and manage your digital shit tightly
Be focused
And it will be ok
Does this help?

What's YOUR advice to your 20 year old self?


Sponsor: Like C#? We do too! That’s why we've developed a fast, smart, cross-platform .NET IDE which gives you even more coding power. Clever code analysis, rich code completion, instant search and navigation, an advanced debugger... With JetBrains Rider, everything you need is at your fingertips. Code C# at the speed of thought on Linux, Mac, or Windows. Try JetBrains Rider today!


© 2019 Scott Hanselman. All rights reserved.
     

GC Perf Infrastructure – Part 1

$
0
0

We open sourced our new GC Perf Infrastructure! It’s now part of the dotnet performance repo. I’ve been meaning to write about it ‘cause some curious minds had been asking when they could use it after I blogged about it last time but didn’t get around to it till now.

First of all, let me point out that the target audience of this infra, aside from the obvious (ie, those who make performance changes to the GC), are folks need to do in-depth analysis of GC/managed memory performance and/or to build automation around it. So it assumes you already have a fair amount of knowledge what to look for with the analysis.

Secondly, there are a lot of moving parts in the infra and since it’s still under development I wouldn’t be surprised if you hit problems when you try to use it. Please be patient with us as we work through the issues! We don’t have a whole lot of resources so we may not be able to get to them right away. And of course if you want to contribute it would be most appreciated. I know many people who are reading this are passionate about perf analysis and have done a ton of work to build/improve perf analysis for .NET, whether in your own tooling or other people’s. And contributing to perf analysis is a fantastic way to learn about GC tuning if you are looking to start somewhere. So I would strongly encourage you to contribute!

Topology

We discussed whether we wanted to open source this in its own repo and the conclusion we wouldn’t mostly just due to logistics reasons so this became part of the perf repo under the “src/benchmarks/gc” directory (which I’ll refer to as the root directory). It doesn’t depend on anything outside of this directory which means you don’t need to build anything outside of it if you just want to use the GC perf infra part.

The readme.md in the root directory describes the general workflow and basic usage. More documentation can be found in the docs directory.

There are 2 major components of the infra –

Running perf benchmarks

This runs our own perf benchmarks – this is for folks who need to actually make perf changes to the GC. It provides the following functionalities –

  • Specifying different commandline args to generate different perf characteristics in the tests, eg, different surv ratios for SOH/LOH and different pinning ratios;
  • Specifying builds to compare against;
  • Specifying different environments, eg, different env vars to specify GC configs, running in containers or high memory load situations;
  • Specifying different options to collect traces with, eg, GCCollectOnly or ThreadTime.

You specify all these in what we call a bench file (it’s a .yaml file but really could be anything – we just chose .yaml). We also provide configurations for the basic perf scenarios so when you make changes those should be run to make sure things don’t regress.

You don’t have to run our tests – you could run whatever you like as long as you can specify it as a commandline program, and still take advantage of the rest of what we provide like running in a container.

This is documented in the readme and I will be talking about this in more detail in one of the future blog entries.

Source for this is in the exec dir.

Analyzing perf

This can be used without the running part at all. If you already collected perf traces, you can use this to analyze them. I’d imagine more folks would be interested in this than the running part so I’ll devote more content to analysis. In the last GC perf infra post I already talked about things you could do using Jupyter Notebook (I’ll be showing more examples with the actual code in the upcoming blog entries). This time I’ll focus on actually setting things up and using the commands we provide. Feel free to try it out now that it’s out there.

Source for this is in the analysis dir.

Analysis setup

After you clone the dotnet performance repo, you’ll see the readme in the gc infra root dir. Setup is detailed in that doc. If you just want the analysis piece you don’t need to do all of the setup steps there. The only steps you need are –

  • Install python. 3.7 is the minimal required version and recommended version. 3.8 has problems with Jupyter Notebook. I wanted to point this out because 3.8 is the latest release version on python’s page.
  • Install the python libraries needed – you can install this via “py -m pip install -r src/requirements.txt” as the readme says and if no errors occur, great; but you might get errors with pythonnet which is mandatory for analysis. In fact installing pythonnet can be so troublesome that we devoted a whole doc just for it. I hope one day there are enough good c# charting libraries and c# works in Jupyter Notebook inside VSCode so we no longer need pythonnet.
  • Build the c# analysis library by running “dotnet publish” in the srcanalysismanaged-lib dir.

Specify what to analyze

Let’s say you’ve collected an ETW trace (this can be from .NET or .NET Core) and want to analyze it, you’ll need to tell the infra which process is of interest to you (on Linux you collect the events for the process of interest with dotnet-trace but since the infra works on both Windows and Linux this is the same step you’d perform). Specifying the process to analyze means simply writing a .yaml file that we call the “test status file”. From the readme, the test status file you write just for analysis only needs these 3 lines – success: true trace_file_name: x.etl # A relative path. Should generally match the name of this file. process_id: 1234 # If you don’t know this, use the print-processes command for a list

You might wonder why you need to specify the “success: true” line at all – this is simply because the infra can also be used to analyze the results of running tests with it and when you run lots of tests and analyze their results in automation we’d look for this line and only analyze the ones that succeeded.

You may already know the PID of the process you want to analyze via other tools like PerfView but we aim to have the infra used standalone without having to run other tools so there’s a command that prints out the PIDs of processes a trace contains.

We really wanted to have the infra provide meaningful built-in help so when you wonder how to do something you could generally find it in its help. To get the list of all commands simply ask for the top level help in the root dir – C:perfsrcbenchmarksgc>py . help

Read README.md first. For help with an individual command, use py . command-name --help. (You can also pass --help --hidden to see hidden arguments.)

run commands

[omitted]

analysis commands

Commands for analyzing test results (trace files). To compare a small number of configs, use diff. To compare many, use chart-configs. For detailed analysis of a single trace, use analyze-single or chart-individual-gcs.

   analyze-single | Given a single trace, print run metrics and optionally metrics for individual GCs.


analyze-single-gc | Print detailed info about a single GC within a single trace. [more output omitted]

(I apologize for the formatting – it amazes me that that we don’t seem to have a decent html editing program for blogging and writing a blog mostly consists of manually writing html ourselves which is really painful)

As the top level help says you can get help with specific commands. So we’ll follow that suggestion and do C:perfsrcbenchmarksgc>py . help print-processes Print all process PIDs and names from a trace file.

arg name arg type description
–name-regex any string Regular expression used to filter processes by their name
–hide-threads true or false Don’t show threads for each process

[more output omitted; I also did some formatting to get rid of some columns so the lines are not too long]

(from here on I will not show the help for each command I use as you can just do that on your own)

I already collected an .etl file with a test called fragment so I’ll run this command on the trace – C:perfsrcbenchmarksgc>py . print-processes C:tracesfragmentPerfViewGCCollectOnly.etl –name-regex fragment –hide-threads

pid name HeapSizePeakMB_Max TotalAllocatedMB command-line args
14392 fragment 1079 3.06e+04 fragment

Now we know the PID, we can make such a test status file that just contains the following lines and put it next to the PerfViewGCCollectOnly.etl file I collected which is in my c:tracesfragment dir: success: true trace_file_name: PerfViewGCCollectOnly.etl process_id: 14392 and I named the file fragment.yaml.

Examples of doing analysis

According to the top level help, for analysis on a single trace, you could use the analyze-single or the chart-individual-gcs command. Let’s try that. C:perfsrcbenchmarksgc>py . analyze-single C:tracesfragmentfragment.yaml Overall metrics

Name Value
TotalNumberGCs 74
CountUsesLOHCompaction
CountIsGen0 32
CountIsGen1 28
CountIsBackground 14
CountIsBlockingGen2 0

[more output omitted] So this gives overall metric and some stats on the first 10 GCs which I omitted here. Looks like we can drill down on this with some commandline args according to the help for this command (readme.md mentions that the metrics I’m specifying here are documented in metrics.md): C:perfsrcbenchmarksgc>py . analyze-single C:tracesfragmentfragment.yaml –gc-where Generation=0 –sort-gcs-descending PauseDurationMSec –single-gc-metrics PauseDurationMSec Generation PromotedMB UsesCompaction –show-first-n-gcs 32 [overall metrics omitted] Single gcs (first 32)

gc number PauseDurationMSec Generation PromotedMB UsesCompaction
6 48.0 0 159 True
33 42.1 0 139 True
50 42.0 0 137 True
3 37.2 0 159 True
8 36.2 0 149 True
69 36.0 0 137 True
66 34.7 0 147 True
35 34.2 0 138 True
71 34.2 0 145 True

[more output omitted] As an example, I purposefully chose a test that I know is unsuitable to be run with Server GC ‘cause it only has one thread so I’m expecting to see some heap imbalance. I know the imbalance will occur when we mark older generation objects holding onto young gen objects so I’ll use the chart-individual-gcs command to show me how long each heap took to mark those. C:perfsrcbenchmarksgc>py . chart-individual-gcs C:tracesfragmentfragment.yaml –x-single-gc-metric Index –y-single-heap-metrics MarkOlderMSec This will show 8 heaps. Consider passing --show-n-heaps. markold-time 
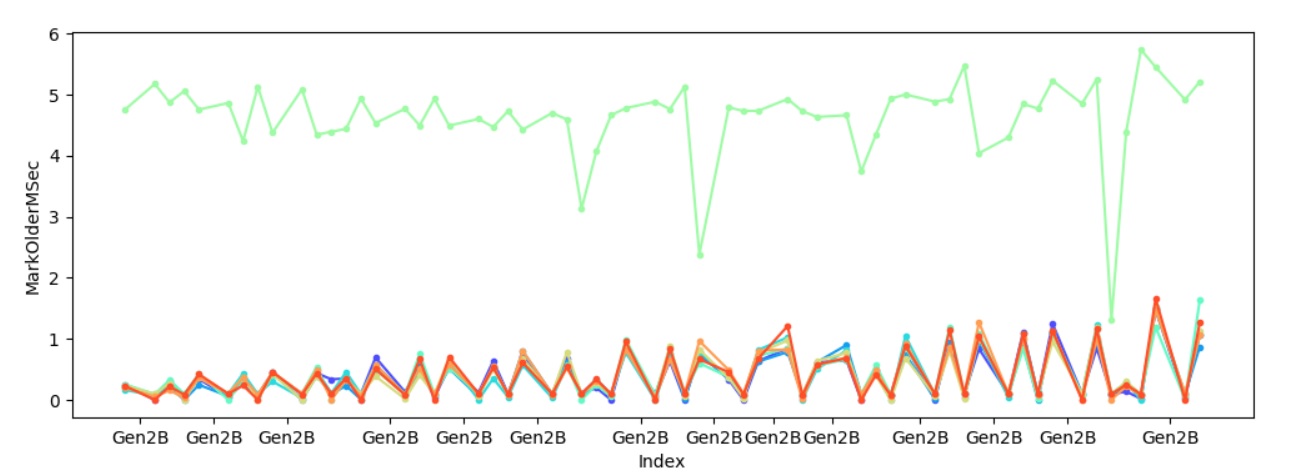
Sure enough one of the heaps always takes significantly longer to mark young gen objects referenced by older gen objects, and to make sure it’s not because of some other factors I also looked at how much is promoted per heap – C:perfsrcbenchmarksgc>py . chart-individual-gcs C:tracesfragmentfragment.yaml –x-single-gc-metric Index –y-single-heap-metrics MarkOlderPromotedMB This will show 8 heaps. Consider passing --show-n-heaps. markold-promoted 
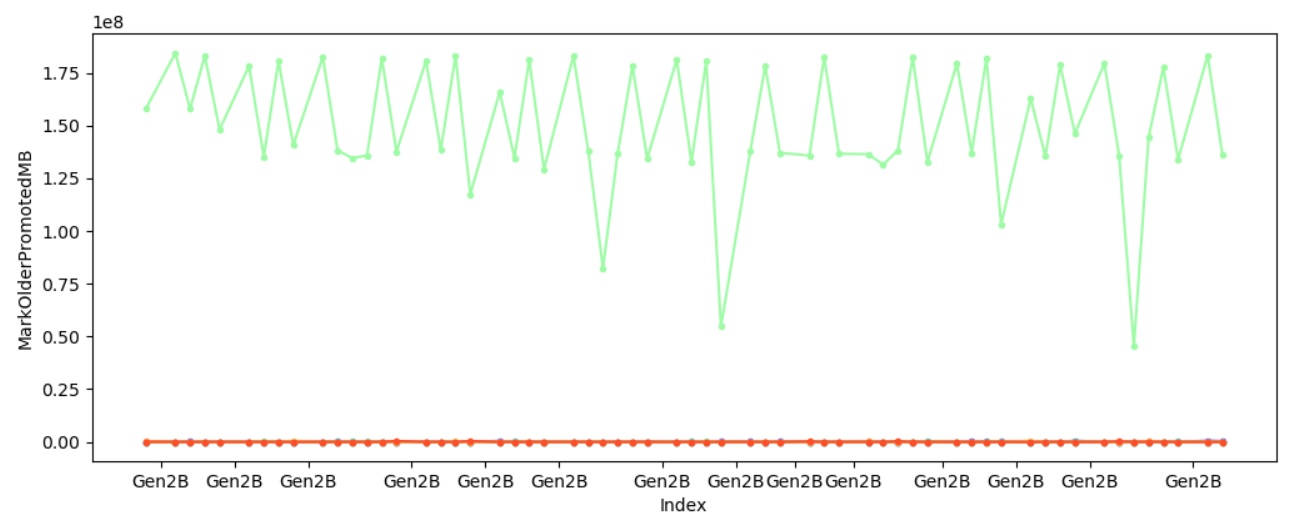
This confirms the theory – it’s because we marked significantly more with one heap which caused that heap to spend significantly longer in marking.

This trace was taken with the latest version of the desktop CLR. In the current version of coreclr we are able to handle this situation better but I’ll save that for another day since today I wanted to focus on tooling.

There’s an example.md that shows examples of using some of the commands. Note that the join analysis is not checked in just yet – the PR is out and I wanted to spend more time on the CR before merging it.


Announcing the preview of Azure Spot Virtual Machines

$
0
0

We’re announcing the preview of Azure Spot Virtual Machines. Azure Spot Virtual Machines provide access to unused Azure compute capacity at deep discounts. Spot pricing is available on single Virtual Machines in addition to Virtual Machine Scale Sets (VMSS). This enables you to deploy a broader variety of workloads on Azure while enjoying access to discounted pricing. Spot Virtual Machines offer the same characteristics as a pay-as-you-go Virtual Machines, with differences in pricing and evictions. Spot Virtual Machines can be evicted anytime if Azure needs capacity.

The workloads that are ideally suited to run on Spot Virtual Machines include, but are not necessarily limited to, the following:

•    Batch jobs.
•    Workloads that can sustain and/or recover from interruptions.
•    Development and test.
•    Stateless applications that can use Spot Virtual Machines to scale out, opportunistically saving cost.
•    Short-lived jobs which can easily be run again if the Virtual Machine is evicted.

Preview for Spot Virtual Machines will replace the preview of Azure low-priority Virtual Machines on scale sets. Eligible low-priority Virtual Machines will be automatically transitioned over to Spot Virtual Machines. Please refer to the FAQ for additional information. 

Pricing

Unlike low-priority Virtual Machines, prices for Spot Virtual Machines will vary based on capacity for a size or SKU in an Azure region. Spot pricing can give you insights into the availability and demand for a given Azure Virtual Machine series and specific size in a region. The prices will change slowly to provide stabilization, thus allowing you to better manage budgets. In the Azure portal, you will have access to the current Azure Virtual Machine Spot prices to easily determine which region or Virtual Machine size best fits your needs. Spot prices are capped at pay-as-you-go prices.
VM size pane in portal showing sizes and spot prices 

Deployment

Spot Virtual Machines are easy to deploy and manage. Deploying a Spot Virtual Machine is similar to configuring and deploying a regular Virtual Machine. For example, in the Azure portal, you can simply select Azure Spot Instance to deploy a Spot Virtual Machine. You can also define your maximum price for your Spot Virtual Machines. Here are two options: 

  1. You can choose to deploy your Spot Virtual Machines without capping the price. Azure will charge you the Spot Virtual Machine price at any given time, giving you peace of mind that your Virtual Machines will not be evicted for price reasons.
     Select capacity only eviction type.
  2. Alternatively, you can decide to provide a specific price to stay in your budget. Azure will not charge you above the maximum price you set and will evict the Virtual Machine if the spot price rises above your defined maximum price.
       Ability to provide maximum price to deploy Spot VM.

There are few other options available to lower costs.

  1. If your workload does not require a specific Virtual Machine series and size, then you can find other Virtual Machines in the same region that may be cheaper.
  2. If your workload is not dependent on a specific region, then you can find a different Azure region to reduce your cost.

Quota

As part of this announcement, to give better flexibility, Azure is also rolling out a separate quota for Spot Virtual Machines that is separate from your pay-as-you-go Virtual Machine quota. The quota for Spot Virtual Machines and Spot VMSS instances is a single quota for all Virtual Machine sizes in a specific Azure region. This approach will give you easy access to a broader set of Virtual Machines.
  Request new quota for Spot VMs.

Handling Evictions

Azure will try to keep your Spot Virtual Machine running and minimize evictions, but your workload should be prepared to handle evictions as runtime for an Azure Spot Virtual Machines and VMSS instances is not guaranteed. You can optionally get a 30-second eviction notice by subscribing to scheduled events. Virtual Machines can be evicted due to the following reasons:

  1. Spot prices have gone above the max price you defined for the Virtual Machine. Azure Spot Virtual Machines get evicted when the Spot price for the Virtual Machine you have chosen goes above the price you defined at the time of deployment. You can try to redeploy your Virtual Machine by changing prices.
  2. Azure needs to reclaim capacity.

In both scenarios, you can try to redeploy the Virtual Machine in the same region or availability zone.

Best practices

Here are some effective ways to best utilize Azure Spot Virtual Machines:

  • For long-running operations, try to create checkpoints so that you can restart your workload from a previous known checkpoint to handle evictions and save time.
  • In scale-out scenarios, to save costs, you can have two VMSS, where one has regular Virtual Machines and the other has Spot Virtual Machines. You can put both in the same load balancer to opportunistically scale out.
  • Listen to eviction notifications in the Virtual Machine to get notified when your Virtual Machine is about to be evicted.
  • If you are willing to utilize pay-as-you-go prices, then use Eviction type to “Capacity Eviction only”, in the API provide “-1” as max price as Azure never charges you more than the Spot Virtual Machine price.
  • To handle evictions, build a retry logic to redeploy Virtual Machines. If you do not require a specific Virtual Machine series and size, then try to deploy a different size that matches your workload needs.
  • While deploying VMSS, select max spread in portal management tab or FD==1 in the API to find capacity in a zone or region.

Learn more

Announcing the General Availability of Proximity Placement Groups

$
0
0

Earlier this year, we announced the preview of Azure proximity placement groups to enable customers to achieve co-location of Azure Infrastructure as a Service (IaaS) resources with low network latency.

Today’s general availability of proximity placement groups continues to be particularly useful for workloads that require low latency. In fact, this logical grouping construct ensures that your IaaS resources (virtual machines, or VMs) are physically located close to each other and adds new features and best practices for success.

Diagram describing the relationship between VMs, VM scale sets, availability sets and proximity placement groups.

New features

Since preview, we’ve added additional capabilities based on your great feedback:

More regions, more clouds

Starting now, proximity placement groups are available in all Azure public cloud regions (excluding India central).

Portal support

Proximity placement groups are available in the Azure portal. You can create a proximity placement group and use it when creating your IaaS resources.

Move existing resources to (and from) proximity placement groups

You can now use the Azure portal to move existing resources into (and out of) a proximity placement group. This configuration operation requires you to stop (deallocate) all VMs in your scale set or availability set prior to assigning them to a proximity placement group.

Supporting SAP applications

One of the common use cases for proximity placement groups is with multi-tiered, mission-critical applications such as SAP. We’ve announced support for SAP on Azure Virtual Machines as well as SAP HANA Large instances.

Measure virtual machine latency in Azure

You may need to measure the latency between components in your service such as application and database. We’ve documented the steps and tools on how to test VM network latency in Azure.

Learn from our experience

We’ve been monitoring proximity placement groups adoption as well as analyzing failures customers witnessed during the preview and captured the best practices for using proximity placement groups.

Azure Portal user interface to configure a proximity placement group and see all the relevant properties.

Best Practices

Here are some of the best practices that with your help we were able to develop:

  • For the lowest latency, use proximity placement groups together with accelerated networking. Accelerated networking enables single root I/O virtualization (SR-IOV) to a VM, greatly improving its networking performance. This high-performance path bypasses the host from the data-path, reducing latency, jitter, and CPU utilization. For more information, see Create a Linux virtual machine with Accelerated Networking or Create a Windows virtual machine with Accelerated Networking.
  • When trying to deploy a proximity placement group with VMs from different families and SKUs, try to deploy them all with a single template. This will increase the probability of having all of your VMs successfully deployed.
  • A proximity placement group is assigned to a data center when the first resource (VM) is being deployed and released once the last resource is being deleted or stopped. If you stop all your resources (including to save costs), you may land in a different data center once you bring them back. Reduce the chances of allocation failures by starting with your largest VM which could be memory optimized (M, Msv2), storage optimized (Lsv2) or GPU enabled.
  • If you are scripting your deployment using PowerShell, CLI or the SDK, you may get an allocation error OverconstrainedAllocationRequest. In this case, you should stop/deallocate all the existing VMs, and change the sequence in the deployment script to begin with the VM SKU/sizes that failed.
  • When reusing an existing proximity placement group from which VMs were deleted, wait for the deletion to fully complete before adding VMs to it.
  • You can use a proximity placement group alongside availability zone. While a PPG can’t span zones, this combination is useful in cases where you care about latency within the zone like in a case of an active-standby deployment where each is in a separate zone.
  • Availability sets and Virtual Machine Scale Sets do not provide any guaranteed latency between Virtual Machines. While historically, availability sets were deployed in a single datacenter, this assumption does not hold anymore. Therefore, using proximity placement groups is useful even if you have a single tier application deployed in a single availability set or a scale set.
  • Use proximity placement groups with the Azure Virtual Machine Scale Set new features (now in preview) which now supports heterogeneous Virtual Machine sizes and families in a single scale set, achieving high availability with fault domains in a single availability zone, using custom images with shared image gallery and more.

Learn more

If you want to learn how you can co-locate resources for improved latency refer to the proximity placement groups documentation.

If you would like to learn more about the latest additions to our Azure IaaS portfolio please read our Azure infrastructure as a service (IaaS) for every workload blog.

You can also watch this brief video to learn more about proximity placement groups. Azure Friday - How to reduce inter-VM latency with Proximity Placement Groups.

Building Xbox game streaming with Site Reliability best practices

$
0
0

Last month, we started sharing the DevOps journey at Microsoft through the stories of several teams at Microsoft and how they approach DevOps adoption. As the next story in this series, we want to share the transition one team made from a classic operations role to a Site Reliability Engineering (SRE) role: the story of the Xbox Reliability Engineering and Operations (xREO) team.

This transition was not easy and came out of necessity when Microsoft decided to bring Xbox games to gamers wherever they are through cloud game streaming (project xCloud). In order to deliver cutting-edge technology with top-notch customer experience, the team had to redefine the way it worked—improving collaboration with the development team, investing in automation, and get involved in the early stages of the application lifecycle. In this blog, we’ll review some of the key learnings the team collected along the way. To explore the full story of the team, see the journey of the xREO team.

Consistent gameplay requirements and the need to collaborate

A consistent experience is crucial to a successful game streaming session. To ensure gamers experience a game streamed from the cloud, it has to feel like it is running on a nearby console. This means creating a globally distributed cloud solution that runs on many data centers, close to end users. Azure’s global infrastructure makes this possible, but operating a system running on top of so many Azure regions is a serious challenge.

The Xbox developers who have started architecting and building this technology understood that they could not just build this system and “throw it over the wall” to operations. Both teams had to come together and collaborate through the entire application lifecycle so the system can be designed from the start with considerations on how it will be operated in a production environment.

Mobile device showing a racing game streamed from the cloud

Architecting a cloud solution with operations in mind

In many large organizations, it is common to see development and operation teams working in silos. Developers don’t always consider operation when planning and building a system, while operations teams are not empowered to touch code even though they deploy it and operate it in production. With an SRE approach, system reliability is baked into the entire application lifecycle and the team that operates the system in production is a valued contributor in the planning phase. In a new approach, involving the xREO team in the design phase enabled a collaborative environment, making joint technology choices and architecting a system that could operate with the requirements needed to scale.

Leveraging containers to clearly define ownership

One of the first technological decisions the development and xREO teams made together was to implement a microservices architecture utilizing container technologies. This allowed the development teams to containerize .NET Core microservices they would own and remove the dependency from the cloud infrastructure that was running the containers and was to be owned by the xREO team.

Another technological decision both teams made early on, was to use Kubernetes as the underlying container orchestration platform. This allowed the xREO team to leverage Azure Kubernetes Service (AKS), a managed Kubernetes cloud platform that simplifies the deployment of Kubernetes clusters, removing a lot of the operational complexity the team would have to face running multiple clusters across several Azure regions. These joint choices made ownership clear—the developers are responsible for everything inside the containers and the xREO team is responsible for the AKS clusters and other Azure services make the cloud infrastructure hosting these containers. Each team owns the deployment, monitoring and operation of its respective piece in production.

This kind of approach creates clear accountability and allows for easier incident management in production, something that can be very challenging in a monolithic architecture where infrastructure and application logic have code dependencies and are hard to untangle when things go sideways.

Two members of the xREO team, seated in a conference room in front of a laptop.

Scaling through infrastructure automation

Another best practice the xREO team invested in was infrastructure automation. Deploying multiple cloud services manually on each Azure region was not scalable and would take too much time. Using a practice known as “infrastructure as code” (IaC) the team used Azure Resource Manager templates to create declarative definitions of cloud environments that allow deployments to multiple Azure regions with minimal effort.

With infrastructure managed as code, it can also be deployed using continuous integration and continuous delivery (CI/CD) to bring further automation to the process of deploying new Azure resources to existing data centers, updating infrastructure definitions or bringing online new Azure regions when needed. Both IaC and CI/CD, allowed the team to remain lean, avoid repetitive mundane work and remove most of the risk of human error that comes with manual steps. Instead of spending time on manual work and checklists, the team can focus on further improving the platform and its resilience.

Site Reliability Engineering in action 

The journey of the xREO team started with a need to bring the best customer experience to gamers. This is a great example that shows how teams who want to delight customers with new experiences through cutting edge innovation must evolve the way they design, build, and operate software. Shifting their approach to operations and collaborating more closely with the development teams was the true transformation the xREO team has undergone.

With this new mindset in place, the team is now well positioned to continue building more resilience and further scale the system and by so, deliver the promise of cloud game streaming to every gamer.

Resources

Networking enables the new world of Edge and 5G Computing

$
0
0

At the recent Microsoft Ignite 2019 conference, we introduced two new and related perspectives on the future and roadmap of edge computing.

Before getting further into the details of Network Edge Compute (NEC) and Multi-access Edge Compute (MEC), let’s take a look at the key scenarios which are emerging in line with 5G network deployments. For a decade, we have been working with customers to move their workloads from their on-premises locations to Azure to take advantage of the massive economies of scale of the public cloud. We get this scale with the ongoing build-out of new Azure regions and the constant increase of capacity in our existing regions, reducing the overall costs of running data centers.

For most workloads, running in the cloud is the best choice. Our ability to innovate and run Azure as efficiently as possible allows customers to focus on their business instead of managing physical hardware and associated space, power, cooling, and physical security. Now, with the advent of 5G mobile technology promising larger bandwidth and better reliability, we see significant requirements for low latency offerings to enable scenarios such as smart-buildings, factories, and agriculture. The “smart” prefix highlights that there is a compute-intensive workload, typically running machine learning or artificial intelligence-type logic, requiring compute resources to execute in near real-time. Ultimately the latency, or the time from when data is generated to the time it is analyzed, and a meaningful result is available, becomes critical for these smart-scenarios. Latency has become the new currency, and to reduce latency we need to move the required computing resources closer to the sensors, data origin or users.

Multi-access Edge Compute: The intersection of compute and networking

Internet of Things (IoT) creates incredible opportunities, but it also presents real challenges. Local connectivity in the enterprise has historically been limited to Ethernet and Wi-Fi. Over the past two decades, Wi-Fi has become the de-facto standard for wireless networks, not due to it necessarily being the best solution, but rather its entrenchment in the consumer ecosystem and lack of alternatives. Our customers from around the world tell us that deploying Wi-Fi to service their IoT devices requires compromises on coverage, bandwidth, security, manageability, reliability, and interoperability/roaming. For example, autonomous robots require better bandwidth, coverage, and reliability to operate safely within a factory. Airports generally have decent Wi-Fi coverage inside the terminals, but on the tarmac, coverage often drops significantly, making it insufficient and less suitable to power the smart airport.

Next-gen private cellular connectivity greatly improves bandwidth, coverage, reliability, and manageability. Through the combination of local compute resources and private mobile connectivity (private LTE), we can enable many new scenarios. For instance, in the smart factory example used earlier customers are now able to run their robotic control logic, highly available and independent of connectivity to the public cloud. MEC helps ensure that operations and any associated critical first-stage data processing remain up and production can continue uninterrupted.

With its promise and advantage of near-infinite compute and storage, the cloud is ideal for large data-intensive and computational tasks, such as machine learning jobs for predictive maintenance analytics. At this year’s Ignite conference, we shared our thoughts and experience, along with a technology preview of MEC with Azure. The technology preview brings private mobile network capabilities to Azure Stack Edge; an on-premises compute platform managed from Azure. In practical terms, the MEC allows locally controlling the robots; even if the factory suffers a network outage.

From an edge computing perspective, we have containers, running across Azure Stack Edge and Azure. A key aspect is that the same programming paradigm can be used for Azure and the edge-based MEC platform. Code can be developed and tested in the cloud, then seamlessly deployed at the edge. Developers can take advantage of the vast array of DevOps tools and solutions available in Azure and apply them to the new exciting edge scenarios. The MEC technology preview focuses on the simplified experience of cross-premises deployment and operations of managed compute and Virtual Network Functions with integration to existing Azure services.

Network Edge Compute

Whereas Multi-access Edge Compute (MEC) is intended to be deployed at the customer’s premises, Network Edge Compute (NEC) is the network carrier equivalent, placing the edge computing platform within their network. Last week we announced the initial deployment of our NEC platform in AT&T’s Dallas facility. Instead of needing to access applications and games running in the public cloud, software providers can bring their solutions physically closer to their end-users. At AT&T’s Business Summit we gave an augmented reality demonstration, working with Taqtile, and showed how to perform maintenance on an aircraft landing gear.

Image of industrial machinist operating advanced robotic equipment

The HoloLens user sees the real landing gear along with the virtual manual along with specific parts of the landing gear virtually highlighted. The mixing of real-world and virtual objects displayed via HoloLens is what is often referred to as augmented reality (AR) or mixed reality (MR).

Edge Computing Scenarios

We have been showcasing multiple MEC and NEC use-cases over these past few weeks. For more details please refer to our Microsoft Ignite MEC and 5G session.

Mixed Reality (MR)

Mixed reality use cases such as remote assistance can revolutionize several industrial automation scenarios. Lower latencies and higher bandwidth coupled with local compute, enables new remote rendering scenarios to reduce battery consumption in handsets and MR devices.

Retail e-fulfillment

Attabotics provides a robotic warehousing and fulfillment system for the retail and supply chain industries. Attabotics employs robots (Attabots) for storage and retrieval of goods from a grid of bins. A typical storage structure has about 100,000 bins and is serviced by between 60 and 80 Attabots. Azure Sphere powers the robots themselves. Communications using Wi-Fi or traditional 900 MHz spectrum does not meet the scale, performance and reliability requirements.
   Flow chart type graphic, depicting service chaining of warehouse robot connected to cloud services via radio controller and 5G packet core
The Nexus robot control system, used for command and control of the warehousing system, is built natively on Azure and uses Azure IoT Central for telemetry. With a Private LTE (CBRS) radio from our partners Sierra Wireless and Ruckus Wireless and packet core partner Metaswitch, we enabled the Attabots to communicate over a private LTE network. The reduced latency improved reliability and made the warehousing solution more efficient. The entire warehousing solution, including the private LTE network used for a warehouse, run on a single Azure Stack Edge.

Gaming

Multi-player online gaming is one of the canonical scenarios for low-latency edge computing. Game Cloud Studios has developed a game based on Azure Play Fab, called Tap and Field. The game backend and controls run on Azure, while the game server instances reside and run on the NEC platform. Having lower latencies results in better gaming experiences for players who are nearby in venues such as e-sport events, arcades, arenas, and similar venues.

Public Safety

The proliferation of drone use is disrupting many industries, from security and privacy to the delivery of goods. Air Traffic Control operations are on the cusp of one of the most significant disruptive events in the field, going from monitoring only dozens of aircrafts today to thousands tomorrow. This necessitates a sophisticated near real-time tracking system. Vorpal VigilAir has built a solution where drone and operator tracking is done using a distributed sensor network powered by a real-time tracking application running on the NEC.
Map imagery with overlays demonstrating mobile network/LTE coverage of industrial site

Data-driven digital agriculture solutions

Azure FarmBeats is an Azure solution that enables aggregation of agriculture datasets across providers, and generation of actionable insights by building artificial intelligence (AI) or machine learning (ML) models by fusing the datasets. Gathering datasets from sensors distributed across the farm requires a reliable private network, and generating insights requires a robust edge computing platform that is capable of being operated in a disconnected mode in remote locations where connectivity to the cloud is often sparse. Our solution, based on the Azure Stack Edge along with a managed private LTE network, offers a reliable and scalable connectivity fabric along with the right compute resources close to the farm.

MEC, NEC, and Azure: Bringing compute everywhere

MEC enables a low-latency connected Azure platform in your location, NEC provides a similar platform in a network carrier’s central office, and Azure provides a vast array of cloud services and controls.

At Microsoft, we fundamentally believe in providing options for all customers. Because it is impractical to deploy Azure datacenters in every major metropolitan city throughout the world, our new edge computing platforms provide a solution for specific low-latency application requirements that cannot be satisfied in the cloud. Software developers can use the same programming and deployment models for containerized applications using MEC where private mobile connectivity is required, deploying to NEC where apps are optimally located outside the customer’s premises, or directly in Azure. Many applications will look to take advantage of combined compute resources across the edge and public cloud.

We are building a new extended platform and continue to work with the growing ecosystem of mobile connectivity and edge computing partners. We are excited to enable a new wave of innovation unleashed by the convergence of 5G, private mobile connectivity, IoT and containerized software environments, powered by new and distributed programming models. The next phase of computing has begun.

Routing made easier with traffic camera images and more

$
0
0

After launching traffic camera imagery on Bing Maps in April, we have seen a lot of interest in this new feature. You can view traffic conditions directly on a map and see the road ahead for your planned routes. This extra visibility helps you make informed decisions about the best route to your destination. Based on the popularity of this feature, the Bing Maps Routing and Traffic team has made some further improvements to this routing experience.

Hover to see traffic camera images or traffic incident details

In addition to clicking on the traffic camera icons on Bing Maps, traffic camera images and details can be accessed now by simply hovering over the camera icon along the planned route. Now you can quickly and easily glance at road conditions across your entire route.

Traffic Camera

The Team also added traffic incident alerts along your planned route, which are shown as little orange or red triangle icons on the map. Just like the traffic cameras, you can view details about these traffic incident alerts by simply hovering over the little triangle icons. The examples below show traffic incident alerts about scheduled constructions and traffic ingestion respectively.

Scheduled Construction Screenshot

Serious Congestion Screenshot

Changes in click behavior

While hovering over the cameras or incident icons launches a popup for the duration of the hover, a click will keep the popup window open until you click anywhere else on the map or hover over another incident or camera icon.

Best Mode Routing

Sometimes, the destination you are trying to get to can be reached by different routing modes (e.g., driving, transit, or walking). In addition to allowing you to easily toggle between different routing modes on Bing Maps, we recently added a new default option of “Best Mode” to the Directions offering where you are served the best route options based on time, distance, and traffic. For example, for a very short-distance trip (e.g., 10 minutes walking), the "Best Mode" feature may recommend walking or driving routes because taking a bus such a short distance may not be the best option, considering wait time and bus fare. Likewise, for trips greater than 1.5 miles, walking may not be the best option. If a bus route requires several transfers, driving may be the better option.

The “Best Mode” feature allows you to view the best route options across modes without having to switch tabs for different modes. Armed with the recommended options and route details, you can quickly see how best to get to where you’re trying to go. Also, click on “More Details” to see detailed driving or transit journey instructions.

Best Mode Routing Screenshot

We hope these new features make life easier for you when it comes to getting directions and routing. Please let us know what you think on our Bing Maps Answers page. We are always looking for new ways to further improve our services with new updates releasing regularly.

- The Bing Maps Team

Viewing all 10804 articles
Browse latest View live


<script src="https://jsc.adskeeper.com/r/s/rssing.com.1596347.js" async> </script>