Quantcast
Channel: Category Name
Viewing all 10804 articles
Browse latest View live

C++ compiler diagnostics improvements in VS “15” RC

$
0
0

This post written by Andrew Marino and Andrew Pardoe

Visual C++ in VS “15” RC now allows you to see where errors are in a line of code—the column number—as opposed to just showing the line number. As C++ has grown it’s increasingly useful to have a little more help finding your errors.

Consider this somewhat contrived example:

int f(int, int);
int main() {
    return f(f(f(1, 2), f(3, 4), 5), f(6, 7));
}

Traditionally Visual C++ would just tell you t.cpp(6): 'f': function does not take 3 arguments. With five different calls to f on one line, it’s hard to figure out where your error is.

Providing column numbers helps greatly: t.cpp(5,32): error C2660: 'f': function does not take 3 arguments. Now at least the compiler has identified which call to f is incorrect.

But you can do more! You can now show the source context with the column information:

t.cpp(4,32): error C2660: 'f': function does not take 3 arguments
     return f(f(f(1, 2), f(3, 4), 5), f(6, 7));
                                   ^

In this mode, the compiler doesn’t just tell you the column, it also points out the error with a caret.

Controlling diagnostics output

You can control the diagnostics format with a new compiler flag, /diagnostics:. There are currently three arguments accepted: classic, column, and caret.

  • classic is the default, showing only the line number. We didn’t change the default because it’s often not a human reading the compiler’s output. Frequently a build system or some other program will be reading the output. In this scenario you want the output to be simple and easily parsed.
  • column provides the next level of information: the column where the error was encountered.
  • caret provides the richest level of information: the context of where the parser found the error and a caret (^) indicating where in the code the error was found.

Customizing output in Visual Studio

Controlling the diagnostic output in Visual Studio is as easy as selecting the level under C/C++ -> General options:

Project properties page

If you select either column or caret, clicking on the error in the error windows will bring the cursor to the column where the error was encountered. For example, the cursor is on the closing parentheses of the call to f that erroneously includes three arguments. Parentheses highlighting (in light grey) shows the scope of the function arguments.

Diagnostics message in VS

At the bottom of this screen you can see the “Col” column. This is off by default in the errors window. Right-clicking on the column headers brings up a dialog where you can select what columns are shown. Selecting the “Col” column allows you to see the column number.

Deleted special member function errors

We haven’t just improved diagnostics formatting—we’re making our diagnostics clearer and more helpful across the board. We’ve made improvements in areas such as static asserts, constexpr, and special member functions.

Here’s an example where code references a deleted special member function. The compiler has generated a default constructor as a special member function. But because the developer supplied an explicit constructor, A(int), the compiler deleted the default constructor. Instantiating a variable with the type of the union that contains A will result in an error to find the default constructor.

struct A
{
    A(int); // non-trivial constructor
};

struct B {}; // trivial constructor

union variant
{
    A a;
    B b;
};

int main()
{
    variant var;
}

Previously the compiler would tell you the nature of the error:

source.cpp(16): error C2280: 'variant::variant(void)': attempting to reference a deleted function
source.cpp(12): note: compiler has generated 'variant::variant' here

Now, it additionally tells you why the function was deleted and points you back at the source of the error:

source.cpp(16,1): error C2280: 'variant::variant(void)': attempting to reference a deleted function
source.cpp(12): note: compiler has generated 'variant::variant' here
source.cpp(12,1): note: 'variant::variant(void)': function was implicitly deleted because a data member 'variant::a' has either no appropriate default constructor or overload resolution was ambiguous
source.cpp(10): note: see declaration of 'variant::a'

Looking ahead

There are many improvements we can make to our compiler diagnostics going forward. The perfect diagnostic would tell you exactly where your error is and how to fix it: we have a long way to go before we get to that point! But we’re committed to making improvements in the accuracy and completeness of our compiler diagnostics.

You may occasionally notice that the column information in a diagnostic is incorrect. This can happen because the code contains multiple-byte characters or because of a bug in the compiler’s parser. Because we’ve never displayed the column number there are a few places where we’ve recorded it incorrectly and haven’t yet found the error. Please let us know if you find a code sample where the diagnostic column information is incorrect!

There area also places where the compiler just won’t emit a column number, even though you’ve asked for columns. There are a couple of examples in the diagnostics above:

source.cpp(12): note: compiler has generated 'variant::variant' here
...
source.cpp(10): note: see declaration of 'variant::a'

This happens because we don’t have column number information in all of our diagnostics. We’re working on expanding the coverage.

We know that we’ve got a long way to go before our diagnostics rival those of other popular C++ compilers. A lot of the 30+ year legacy of the Visual C++ compiler shows in our diagnostics quality. But this is a first step, and we’re committed to continuing the improvements.

Send us your feedback!

As always, we welcome your feedback. For problems, let us know via the Report a Problem option, either from the installer or the Visual Studio IDE itself. For suggestions, let us know through UserVoice. And you can always reach us through e-mail at visualcpp@microsoft.com.


C++ IntelliSense Improvements – Predictive IntelliSense & Filtering

$
0
0

IntelliSense is one of the most commonly used features in Visual Studio. With it, developers can write code more efficiently and learn more about their codebase at the same time. In a sense, IntelliSense is both a guide and a productivity feature. We understand the importance of having a powerful IntelliSense system which displays highly relevant results right when they are needed and which minimizes the time you need to spend thinking or typing as a developer. We have been collecting your feedback for C++ IntelliSense and are happy to announce two major improvements in Visual Studio “15” Preview 5: Predictive IntelliSense and IntelliSense Filtering.

Predictive IntelliSense uses contextual awareness to limit the number of results displayed in the IntelliSense dropdown list. Many of you have pointed out that the dropdown list can get quite long, necessitating a lot of scrolling. With Predictive IntelliSense, we employ type matching to give you results that match the expected type that you will usually need. In the simplest case, if you type int x = and invoke the IntelliSense dropdown, rather than seeing a giant list of all possible results, you will see only integers or functions returning integers. Predictive IntelliSense also excludes several different kinds of results in other cases where Visual Studio expects those kinds aren’t relevant. The result is a far more concise list. This feature is currently experimental and is turned off by default, but you can turn it on by going to Tools > Options > Text Editor > C/C++ > Experimental > Enable Predictive IntelliSense.

1

Of course, we understand that sometimes, Predictive IntelliSense might not work out and you might need to go back to the longer list. We always had a hidden keyboard shortcut built into Visual C++ which expands the list of IntelliSense results. By default, that shortcut is Ctrl + J. Ctrl + J was used in the past to do things like removing the accessibility filter, which hid private and protected members in Member List results. Now, if Predictive IntelliSense is on, invoking Ctrl + J removes the Predictive filter, going back to the list you are accustomed to from earlier releases. Pressing Ctrl + J again removes the accessibility filter from Member List results where relevant. We have also added a button ([+]) under the IntelliSense dropdown list which does the same thing as Ctrl + J. Hovering over the button gives you some useful tooltip information about what is being shown.

2

If you check the screenshot above, you will notice there are even more buttons under the dropdown list however. That is because we also added a set of IntelliSense Filters for different kinds of results which you can toggle based on your needs to narrow down the list:

  • Variables and Constants
  • Functions
  • Types
  • Macros
  • Enums
  • Namespaces

We only list the filter buttons relevant to your current IntelliSense session so you often won’t see all the buttons at once.

Send us your feedback!

Please try Preview 5 and these new IntelliSense features. We’re always interested in hearing what you think so we can improve Visual Studio. For C++ IntelliSense suggestions/ideas, please feel free to email me directly at aupopa@microsoft.com or post/upvote ideas on UserVoice. You can submit bug reports via Connect as well, and don’t forget, you can always Send a Smile or a Frown right from Visual Studio if that works better for you.

CMake support in Visual Studio

$
0
0

This article describes the current proof-of-concept support for CMake in Visual Studio. As we evolve the experience in upcoming preview releases, we will continue to update the content here.

What is CMake

CMake is a cross-platform open-source tool for managing build processes across multiple platforms by abstracting away native build environments and compilers. CMake interprets a CMake script the user authors and generates a build plan in a build environment of choice (e.g. in Visual studio projects, make scripts, Xcode projects, etc.).

Since the beginning, CMake had support for Visual Studio targeting and it has closely paired each release of Visual Studio with a CMake generator allowing users to target a long list of VS versions throughout the years. The latest version supports every version of VS starting with 2005 and up to our latest preview release VS ’15’.

CMake momentum and your feedback

CMake has seen a tremendous uptick in the C++ community in recent years across all platforms. In our developer surveys, we have seen CMake constantly grow in usage year over year since 2012, surpassing in 2015 the make family (make/gmake/nmake) in terms of adoption.

With so many of you starting to use CMake with Visual Studio, we heard a lot of feedback and we’ve been constantly thinking of ways to improve the VS experience for CMake users. In 2014, we’ve contributed support for generating Visual Studio C++ projects targeting Windows Store and Windows Phone and in 2015, we’ve contributed support for generating Visual Studio C++ projects targeting Android.

But that only scratched the surface of the feedback we’ve been hearing. There is only so much a command line tool — even one like CMake — can do to control the C++ IDE experience and we heard from many of you that:

  • It is not obvious which IDE features apply to CMake projects and which get lost when regenerating the VS projects
  • For developers new to CMake, CMake language has a steep learning curve and its generated MSBuild-based projects are difficult to diagnose
  • The switch between command line (to invoke CMake) and IDE to write code creates friction, made worse by the need to generate separate solutions to target x86 or X64to target various architectures
  • CMake regeneration of VS projects causes a non-elegant solution reload experience in VS that disrupts the coding experience. Solution reload required by CMake during build is even more aggravating.
  • Solution Explorer’s view of the generated VS projects does not resemble the disk organization of the CMake projects making it hard to navigate

Visual Studio support for CMake

Two initiatives that started taking shape in early 2016 marked a turning point in our planning. By this time, we already knew we wanted to tackle this problem space but we weren’t sure yet how to fix many of the challenges we heard from you.

  • The first initiative, in the CMake community, was the CMake-server prototype developed initially by Stephen Kelly to improve the tooling story for CMake. This started some interesting conversation in the CMake community as well as internally in our team and it was dubbed the missing link between CMake and the IDE.
  • The second one, a Visual Studio initiative (“Open Folder”) designed to enable the developer inner-loop (edit-build-debug experience) without the existing VS solution & C++ project system infrastructure, allowing non-MSBuild C++ codebases to be loaded in Visual Studio in a folder-based experience. This is now part of Visual Studio ’15’ “Open Folder” C++ capability.

Visual Studio ’15’ Preview 5 is the first release where we use both functionalities in conjunction in a proof-of-concept implementation of our CMake support in Visual Studio. While it will not be something you can try with your own CMake projects yet — this is coming in a future preview –, the current implementation tells us a lot about the underlying technologies and we’re more confident now that with future previews, we can deliver a solid CMake integration. VS can now:

  • Enumerate CMake targets and files for each target,
  • Detect outputs for CMake targets,
  • Collect compiler switches including default system paths for files,
  • Configure, build and install CMake scripts,
  • Detect changes in CMakeLists.txt and dependents and reconfigure automatically
  • All without needing a dedicated CMake generator

What’s next

Moving forward we will continue building on this functionality — stay tuned for a future preview in which you can try the VS support with your own CMake project. For now, if you want to experiment with our early prototype start with the example below and watch the CMake demo in our Visual Studio talk “Latest and Greatest from the Visual Studio Family for C++ developers” at CppCon.
CMakeLists.txt

cmake_minimum_required (VERSION 3.6)
project (hello-world)

add_executable(hello-world hello.cpp)

install(TARGETS hello-world DESTINATION bin)

Hello.cpp

#include 
#include 

int main(int argc, char* argv[])
{
    std::cout << "Hello" << std::endl;
}

The list of possible operations is available by right clicking on the CMakeLists.txt in Solution Explorer: Build, Clean, Install and Debug.


Visual C++ Compiler Version

$
0
0

This blog was written by Gabriel Dos Reis and Mark Levine.

Starting with VS “15” Preview 5, the Visual C++ Team is monotonically updating the value of the built-in preprocessor macro _MSC_VER at every Visual C++ toolset update.

Why?

Thanks to the investments and progress that the Visual C++ Team has been making in the area of ISO C++ implementation conformance, we have been shipping new language features and introducing new conformance changes at a pace never seen before  by our customers, in particular in updates to the Visual C++ toolset.  As a result, it has become necessary for our customers to have a good way to differentiate between updates of VC++ (and not just major versions) within their source code.  For instance, a program wanting to make use of the C++11 noexcept feature with VC++ would typically write:

#if _MSC_VER >= 1900
// … use noexcept here …
#endif

How to Test?

Traditionally, developers write conditionally-included pieces of code testing the value of the built-in preprocessor macro _MSC_VER against known values indicating major releases of the Visual C++ compiler. For example,

_MSC_VER >= 1900

tests for any version of the Visual C++ compiler released after VS2015 RTM. That continues to be our recommended practice. What we are doing, starting with VS “15”, is to increment the value of _MSC_VER at each update.

To test for VC++ updates or releases after a given reference point, use the “>=” (greater-or-equal) operator to compare _MSC_VER against that known reference value. Furthermore, if you have several reference points to compare against in a mutually exclusive manner, we recommend you order your comparisons in decreasing order of the reference values. For instance, the following snippet

#if _MSC_VER >= 1900
// …
#elif _MSC_VER >= 1800
// …
#else
// …
#endif

checks for compilers released after VS2015, then compilers released after VS2013, then takes an action for all compilers released prior to VS2013.

Ordering Tests with <

If you chose to use the less-than operator (<), then we recommend that you order your tests in increasing order of the reference values.

Checking for A Specific Compiler Version

On very rare occasions, you might be looking for a specific VC++ release. Only in such circumstances would you need to use the equality operator “==” to compare _MSC_VER against a known value. Such circumstances include working around a bug in a well-known version of VC++. However, in general, we recommend you use the “>=” and order your tests in decreasing order.

Looking for A Closed Set of Compiler Versions

Some circumstances require looking for a closed set of compiler versions. For instance, this code fragment

#if _MSC_VER >= 1900 && _MSC_VER < 2000“mspdb140.dll”
#endif

includes the string literal “mspdb140.dll” only when the compiler is from the VS2015 vintage. In these situations, you will use “>=” and “<” to construct a semi-open interval that delimits the release series you are interested in.

When Should I Use _MSC_FULL_VER Then?

_MSC_FULL_VER is a more granular variant of the built-in preprocessor macro _MSC_VER that incorporates also the build number of the compiler. You would use this when you want to differentiate between micro-updates of the same update. Until now, it has also been used to differentiate between updates.

What About _MSC_BUILD?

It is a built-in preprocessor macro, documented here, rarely used or needed in most C or C++ source code.

The Compiler Versioning Scheme

Each major release of the Visual C++ compiler increments the “hundreds” of _MSC_VER. Each update within a major release increments the “units” by 1. For example, in VS “15” Preview 5, the macro _MSC_VER evaluates to 1910. The next update will have _MSC_VER set to 1911.

Note that VS “15” and VS2015 are both major releases of Visual Studio with different major version numbers. The included compiler toolset, however, will have the same major version number – with the change described here, the minor version number can be used to distinguish compiler toolsets.

Call to Action

If you have existing code that compares _MSC_VER using the equality operator, have a second look and see if that comparison is better expressed with the greater-or-equal operator as explained above.

Visual Studio “15” Preview 5 Now Available

$
0
0

Visual Studio “15” Preview 5 is now available. Read the official announcement on the Visual Studio blog.

Highlights for C++ developers include:

  • Faster project load, coding, and debugging for C++.
  • The C++ Core Checkers for enforcing the C++ Core Guidelines are now distributed with Visual Studio.
  • Enhanced support for C++11 and C++14 features, as well as preliminary support for certain features expected to be in the C++17 standard. This release includes complete support for generalized constexpr.
  • Improvements, fixes and additions to the Standard Template Library.
  • Enhanced C++ code generation of loops and C++ code security.
  • IntelliSense Filters and Experimental C++ Predictive IntelliSense pare another way to narrow down the results in the list by specific kinds.
  • Navigate To (now known as Go To) and Find All References have been overhauled to improve the code navigation experience
  • The popular extension Visual C++ for Linux Development is now part of Visual Studio.
  • C++ support in “Open Folder” as well as proof-of-concept CMake support.
  • And more…

For the complete list of everything in this release, along with some known issues, look at the Visual Studio “15” Preview 5 Release Notes page. The Preview 5 FAQ provides answers for common questions.

As always, we welcome your feedback. Try the report a problem feature in the IDE to share feedback on Visual Studio and check out the developer community portal view. If you are not using the Visual Studio IDE, you can report issues using the Connect Form for reporting issues.

For suggestions, let us know through UserVoice.

We look forward to your feedback.

How we work and lessons we’ve learned building Team Services and TFS

$
0
0

Here are two recent presentations that discuss the evolution of our team from an on-premises software team to a DevOps services team.

The first one is a presentation by Matt Manela and Jose Rady Allende at Microsoft Ignite last week. Matt is the engineering manager and Jose the PM for one of the feature teams building the Agile features in Team Services and TFS. They provide a first hand view of how the way we work has changed as well as what’s worked well for their own team. Not only does the talk cover how we worked before DevOps, how the team is organized, and how we do planning, it also covers our test philosophy, the engineering metrics we track, and a team organization approach they’ve found to work well for their feature team. Even if you seen a past presentation like the one Lori and Brian gave at Build, there’s new material in it. You can find it at Microsoft Ignite On-Demand and on YouTube.

The second is a presentation that I gave two weeks ago at the ITARC Southeast 2016 conference. In it I talk about

  • the evolution of the service, including deployment including online database upgrades,
  • using feature flags to control exposure,
  • circuit breakers to prevent cascading failures,
  • and where we are headed in trying to detect indications of problems within the large volume of telemetry we collect.

This talk was also the basis for a recent blog post on feature flags. You can find the presentation on YouTube.

The two talks cover different material with almost no overlap and together provide a lot of insight into how we work and the lessons that we’ve learned along the way.

Enjoy!

Follow me at twitter.com/tfsbuck

Faster C++ solution load with VS “15”

$
0
0

The Visual C++ product has had projects ever since its inception.  Visual C++ had its own IDE up through Visual Studio 6.  Starting in Visual Studio .NET, C++ moved to a new IDE shared by Visual Basic, C#, C++, and other tools.  This new IDE used COM everywhere and items in the Solution Explorer were based on IVsHierarchy.  Much of the existing project system was kept intact but it was exposed through a new set of COM objects that implemented IVsHierarchy and other interfaces.

In Visual Studio 2010, the underlying project/build system was changedfrom VCBuild to MSBuild.  This is also when the file extension changed from .vcproj to. vcxproj.  At this point, the existing set of (relatively new) COM objects was kept, but forwarded into a new set of managed “shim” objects that then called into the new project system.  This new project system eventually became known as the Visual Studio Project System (VSPS).

As years went by, developers created ever larger solutions and projects.  This created a problem as Visual Studio took longer and longer to load these ever-increasing solutions.  Each project would get parsed and a large graph of objects would be created in memory and kept there.  At least one object per node in the hierarchy would get created.  This approach takes a lot of time and uses a lot of memory.  Visual Studio tried to keep up and has implemented various strategies to support large projects.  For instance, you can explicitly unload projects to prevent them from getting loaded and ASL (Asynchronous Solution Load) was introduced in Visual Studio 2013.  ASL tries to load most projects on a background thread and make the UI immediately responsive for other tasks.

While ASL works to a large extent, we have heard from many developers that they prefer to just wait for the whole solution to finish loading and all other background work to finish before trying to use the IDE.  You know, open your solution and go get coffee.

Even after all of the projects are loaded, there is still other stuff happening that is using CPU and disk.  In the status bar, you are probably used to seeing the following:

initializingprojects

This message means we are doing what we call a “design-time build”.  The VSPS is evaluating projects and figuring out what would be built and how it would be built.  We do this to generate command-lines for every file in every project and then compare them to what we have stored in the browse database.  If they have changed, we write them into the database.  The command lines are used for Intellisense and also to resolve include files that are indexed in the browse database.

After this “initializing” phase you will see that we are checking for out-of-date files (and then updating them if needed).  Finally, the status bar shows ready.  However, if you take a look in Task Manager, you will notice that one CPU is still getting heavily used.  In the background, we are still doing work.  The first task is populating the “external dependencies” node of each project.  This node contains files that aren’t explicitly in the project but are #included directly or indirectly by some file in the project.  After this step, there is one more invisible step which checks the database for orphaned records, such as files we indexed that aren’t used anymore (directly or indirectly) by any project.  All of this happens every time you open a solution even if absolutely nothing has changed since the last time you used it.

Let’s take a look at loading the Chromium solution and see how long each of these steps is taking in Visual Studio 2015 Update 3 vs. Visual Studio 15 Preview 5.  If you follow the instructions on the Chromium website, the solution is generated by the command “gn gen –ide=vs out\Default”.  This results in ~4600 projects of which ~1000 are “Solution Folders” and the others are .vcxproj projects.

picture

The following results are on Windows 10 from my personal machine which is an Intel Core i7-4790 @ 3.6GHz and two SSDs: one as system drive and one for source code (Samsung 850 Pro).  The first set of results is in Visual Studio 2015 Update 3 and the second set is from Preview 5 of Visual Studio 15.

We realize that the “parsing/resolving includes” phase is about 25% slower than in VS2015 Update 3.  We are working on improving this as well and expect to get that resolved soon.

Why is solution load with Visual Studio “15” so much faster?

Because of our existing layered architecture, it was relatively easy to insert a new caching layer that can answer many questions about projects and configurations without having to actually load the project into the VSPS.  This new layer uses a SQLite database to quickly retrieve information on demand.

When a solution is loaded and we are asked to load a C/C++ project, we get a list of all .vcxproj files this solution will load.  We check the database to see if we already have these projects and if any files have changed.  If we need to update the information about a set of projects, those projects are put into a queue.  That queue is handled by multiple external processes that use MSBuild to load the projects and collect information about them and write it to the database.

As we are asked to load each project, we create a set of small shim objects that can service many requests without needing to fully load a project.  We can provide all of the information that our Intellisense engine needs, as well as provide what Solution Explorer needs through information in the database.  If an API is called that needs a real project (such as modifying project settings), the underlying shim will load the project on the fly and delegate to it.

Because of this change the load time of individual projects went way down, but not as low as we desired.  Profiling revealed some pretty bad algorithms with N^2 time complexity in various places.  Our memory use also dramatically dropped after this change, but we also found some pretty bad memory use inside our own objects.  We were able to trim the size of each object that represents a file in a solution (including external dependencies) from 120 bytes to 44 bytes per instance.  It may not seem like much, but some large solutions end up with millions of these objects.  We are still working on improving the performance of project load and I expect to see some additional improvements before shipping the final version.

This feature is truly experimental, there are still some issues with fast project load we want you to be aware of.

  1. Projects that need upgrading should be upgraded first before trying to use fast project load on them as upgrade will not happen during FPL.
  2. Our story today for being able to build is not complete for this preview release. Very simple solutions with one project might build but that’s pretty much it.
  3. Projects will load through VSPS on demand such as when explicitly editing a project (e.g. adding files or changing properties).  A large
    project may take a few seconds to load.  We want to signal this to the user but we haven’t yet in all cases.
  4. Third party plugins could choose to walk the entire solution hierarchy asking for properties that causes all projects to be fully loaded in VSPS, effectively defeating any benefits of FPL.

The IDE’s Output Window will display a message whenever a project is fully loaded into the VSPS.  Please let us know if you see these messages unexpectedly.

Lightweight Solution Load

There is another experimental effort underway in Visual Studio to improve solution load called “lightweight solution load”.  This is a completely different approach and you can read about it here.  Generally, it will avoid loading projects at all and will only load a project when a user explicitly expands a project in Solution Explorer.  The C++ team has been focused on Fast Project Load and so our support for lightweight solution load is currently minimal.  In the RC  release of Visual Studio 15, we expect to support FPL in conjunction with Lightweight Solution Load.  This combination should provide a great experience.

Wrap Up

As always, we welcome your feedback and we would love to learn from your experiences as you try these features out. Do let us know if you run into any issues trying out faster solution load through report a problem tool.

You can also email us your query or feedback if you choose to interact with us directly! For new feature suggestions, let us know through User Voice.

Faster C++ build cycle in VS “15” with /Debug:fastlink

$
0
0

Continuing with our goal of further improving developer productivity with Visual Studio “15” there have been major investments made for also improving incremental developer builds. The developer incremental build is one where a developer changes a single or multiple source files and builds. The time spent in these builds is almost equal to the time spent in linking the binaries. With Visual Studio 2015 we introduced a new linker switch ‘/debug:fastlink’. With ‘/debug:fastlink’ developers on average see an improvement of 2-4x in clean link times.

So why is /debug:fastlink so much faster for link times?

Well, with /debug:fastlink the linker-produced PDB doesn’t have any private symbol information. Debug information is distributed among input object and library files, and the linker PDB just serves as an indexing database. While this provides a huge performance benefit for the daily developer builds, there is one scenario you will need to handle differently, and that is when you want to share the linker PDB with another developer on the team or upload the linker PDB’s directly to symbol server. There have been requests for tooling which is able to create a full PDB from the /debug:fastlink PDB on demand and with this release we are doing just that. Developers will now be able to generate a full PDB from a /debug:fastlink PDB both at a solution, project level using the new options shown in the figures below:

fastlink

/Debug:fastlink now default setting for new and existing projects (Debug Configuration)

Another issue with using /debug:fastlink is its lack of discoverability and today developers need to play around with linker property pages to discover this feature. Starting with Visual Studio ‘15’ /debug:fastlink will serve as the default program database file generation setting for new project templates.

In addition to changing the default setting for program database file generation, with this release we are also changing the definition of the existing program database generation linker flag:‘/debug’ to map to ‘/debug:fastlink’ for the ‘Debug’ configuration in Visual Studio.

This will allow us to migrate all existing Visual Studio developers to use /debug:fastlink by default. Developers can opt-out of this behavior by adding the ‘/debug:full’ linker switch to linker command line or by enabling the ‘Generate Full Program Database File’ as shown in the property page below.

props

We missed the opportunity to unify ‘Generate Debug Info’ and ‘Generate Full program Database File’ for this setting but will be doing so for the upcoming release.

Another thing we would like to share on this front is that in Visual Studio “15” we are working on further improving /debug:fastlink by moving name hash building from link time to DIA (or debug) time. There is a small increase in time taken for first name lookup related debugging actions (like function/data lookup by name for expression evaluation in watch windows) but it’s only noticeable for very large binaries (>50 Mb). The figure below highlights the link time improvements you will obtain with /debug:fastlink over /debug in the next update for Visual Studio “15”.

bp

Wrap Up

As always, we welcome your feedback and we would love to learn from your experiences as you try these features out. Do let us know if you run into any issues trying out /debug:fastlink or fail to see any link speed improvements. You can also email us your query or feedback if you choose to interact with us directly! For new feature suggestions, let us know through User Voice.


What’s new in Visual Studio “15” Preview 5 for Universal Windows Developers

$
0
0

In Visual Studio 2015 Update 3, we introduced support for building apps that target the Windows Anniversary Update SDK. Visual Studio “15” continues where VS 2015 left off and brings several new experiences and enhancements for UWP developers. We have been focusing on improving three major areas:

  1. Quick and easy getting started experience with building a UWP application
  2. Productive experiences when authoring or debugging code
  3. Performance and reliability improvements

While you’ll continue to see a steady stream of improvements in upcoming releases of VS “15”, there are several new experiences in this release for you to try and give feedback.

UWP tools with the new Visual Studio “15” installer

Getting started with tools for UWP development has never been easier or faster. With Visual Studio “15”, we have optimized the Universal Windows Platform development workload for developers to get up and running as quickly as possible. We give you just the right tools to be productive in authoring, debugging, and publishing UWP apps. Don’t worry, if something is missing by default, you will be able to add it later.

With the default experience for the Universal Windows Platform development workload, the size on disk has reduced by over 60% compared to Visual Studio 2015. That means shorter download time, quicker install, and faster to get to coding!

Visual Assets for apps made easier

We’ve visually refreshed the Manifest Designer and made it easier to create branding manifest assets for your UWP apps. With the Manifest Asset Generator, you can create all the visual assets for your apps from within the Manifest Designer. Using a single source image, you can create tiles, logos, icons and splash screens at any or all scales to fit every type of device your app targets. We take care of adhering to all the design guidelines suggested for Windows 10 apps like padding and background colors. The current release supports C# and Vb. Support for C++ and JS is planned for a future release of Visual Studio.

Discover accessibility and performance issues with the new UI Analysis tool

To help you discover hard to find issues around accessibility and performance, we’ve expanded on the XAML UI Debugging tools with the new UI Analysis tool. The tool can be enabled for UWP apps by enabling it in the Select Tools menu of the Diagnostics Tools Window.

Once enabled, the UI Analysis tools will examine the elements in your app, searching for common performance or accessibility issues. These will show up in the Events window along with links to MSDN. If an element isn’t exposing a Name property, a property critical to screen readers, the UI Analysis tool will flag the element as being problematic. Similarly, a ListBox that isn’t properly virtualizing its contents can cause significant performance issues. The UI Analysis tool will detect this and provide documentation on how to fix it. These are just a few of the issues that the UI Analysis tool can help identify. The Filter menu provides the complete list of issues that can be detected.

Improvements to the XAML Designer

Creating elements from the toolbox will now create leaner XAML with less tags. For instance, elements dragged directly from the toolbox onto the artboard will be created without explicitly setting the Width and Height. Our goal is cleaner, more readable XAML and this represents a major ask from our customers.

A new options menu on the artboard allows the developer to quickly change the theme for the artboard. By clicking the options gear, the developer can switch the visual theme and/or modify the High Contrast settings, and these settings will be reflected immediately on the design surface. This will allow developers to view a wider range of settings immediately without having to constantly change the settings on their development machine.

Finally, the numeric value editors in the Properties window now support basic arithmetic (thanks for the UserVoice suggestion!). The value editor will evaluate the equation and replace it with the corresponding value, and insert that value into the XAML. For instance, if a developer wished to increase the Width of a 36px wide Button by 8px, they could calculate that value in their head, or merely type “36+8”. The value editor will evaluate that equation and replace it with 44.

Faster XAML tab switch and snappier XAML typing experience

We have made investments to make interacting with XAML files snappier. One area where this would be most apparent is navigating away from XAML files or switching between XAML files. We have data that suggests 1 in 4 developers experience at least one XAML tab switch delay of more than 1 second every day. These delays could be higher in projects that have a large number of XAML files and/or resource dictionaries among other things. With Preview 5, the tab switching experience will be almost instantaneous for a majority of developers. Projects that experienced larger delays should see improvements by an order of magnitude. On sample customer apps, we saw more that 90% improvement in tab switch times.

We have also fixed several XAML editor typing delay issues. Most developers should find the XAML editor and the XAML IntelliSense to be more responsive. This would be most apparent when editing a XAML file in projects that consume third party controls or large control libraries.

Tell us what you think

As always, we welcome your feedback. For problems, let us know via the Report a Problem option in Visual Studio. Track your feedback on the developer community portal. For suggestions on how we can make Visual Studio even better for building Universal Windows apps, let us know through UserVoice.

Karan Nandwani, Program Manager, Visual Studio
@karann9

Karan works on the XAML Tools Team in Visual Studio. He owns XAML editor features and enjoys designing next-gen productivity enhancement tooling. In his free time, he likes biking, FPS games, and EDM.

Compiler Tools Layout in Visual Studio “15”

$
0
0

You’ll see many improvements for C++ developers in Visual Studio “15” as soon as you load your first project. But some of the changes in the product aren’t so obvious. One in particular might surprise you: we’ve moved where the MSVC compiler toolset is laid out on disk.

Why we moved the compiler toolset

The layout of the compiler tools on the disk in VS 2015 reflects decisions made years ago. When we shipped Visual Studio .NET in 2002, we shipped compilers that targeted only the x86 architecture. The x64 and Itanium architectures had only recently been announced when development of Visual Studio .NET started. The layout of the compiler on-disk reflected a world where x86 was the only compiler you would need.

When we introduced support for the Itanium and x64 architectures we added the compilers where it made sense: in the bin directory. We already had a compiler for x86 in the bin directory, so we added subdirectories x86_ia64 and x86_amd64 for compilers that run on x86 and target 64-bit platforms as well as an amd64 directory for compilers that run on x64.

Unfortunately, it didn’t stop there. We added compilers for ARM. And we added cross-targeting compilers that are hosted on x64 and target x86 and ARM. Eventually we ended up with a directory tree that made little sense. Every time a developer wants to write automation that deals with our compilers they have to write special cases in their scripts for the x86 hosted and targeting compiler. Moreover, this layout limits our ability to do interesting things such as having two versions of a compiler or two different compilers installed side-by-side on the one build machine.

Where the compiler toolset moved to in VS “15”

First, let’s discuss the major parts of the compiler toolset. These are reflected in the top-level directory, e.g., %ProgramFiles(x86)%\Microsoft Visual Studio\VS15Preview\Common7\IDE\VisualCpp. (Note that this directory, %VCINSTALLDIR%, changed from its VS 2015 location of %ProgramFiles(x86)%\Microsoft Visual Studio 14\VC.)

  • Tools: The tools are what you traditionally think of as the MSVC compiler toolset. This includes the old bin, crt, include, and lib directories and the binaries that are placed in them. These binaries include cl.exe and link.exe as well as header files and link libraries for the Visual C++ runtime.
  • Redist: The redistributable directory contains files that can be redistributed by the end developer with the built application. The CRT redistributables are located here, as well as the other runtimes such as those for AMP and OpenMP.
  • Auxiliary: The auxiliary directory contains tools and scripts that are not part of the compilation process but are needed to help with various compilation scenarios. These include files like the CppCoreCheckers or the Unit Test libraries as well as the vcvars*.bat scripts used to configure developer environments.

Note that the compiler toolset layout in Preview 5 is just that–a preview. We may end up changing the layout or even the top-level %VCINSTALLDIR% directory depending on feedback and requirements from internal and external developers.

The tools directory

Let’s take a closer look at the Tools directory–the directory contains the compiler toolsets. Unlike in VS 2015, the Microsoft Visual C++ compiler is in a directory called MSVC. If you installed the “Clang with Microsoft Codegen” option, you’ll see a directory next to MSVC called ClangC2 that contains the Clang/C2 binaries.

path1

There’s a subdirectory in the MSVC directory with a compiler version number. For Preview 5, that version number is 14.10.24516.00. In that directory are the familiar subdirectories from the %VCINSTALLDIR% directory in VS 2015: bin, crt, include, and lib.

We’ve encountered two big differences so far. First, the MSVC directory means that the Visual C++ tools can sit beside another toolset, in this instance, ClangC2. Second, the fact that the tools are versioned inside of the MSVC directory means that we can have multiple versions of the Visual C++ compiler installed on the same build machine. Right now, there’s no simple way to install multiple versions. But we’ve designed the directory structure to make it possible in the future to easily switch between versions of the Visual C++ tools.

Hosts and targets

We find even more changes when looking inside the 14.10.24516.00\bin directory. While in VS 2015 the x86 toolset was the “standard” toolset and we had directories with names like amd64_arm representing the AMD64-ARM cross-targeting compiler, in VS “15” these have been split up into directories labelled HostXXX and a subdirectory called x86 or x64. What’s the distinction here?

path2

Let’s pause to define a couple of terms. “Host” refers to the platform that the compiler toolset runs on. “Target” refers to the platform that the compiler builds applications to run on. In the VS 2015 world, amd64_arm included the compilers that were hosted on x64, and targeted ARM. In VS “15” it’s more structured: all of the x64 hosted compilers live in a directory called HostX64. In that directory we find x86, x64, etc., indicating the target architecture.

The bin directory is the only one with a set of HostXXX directories. This is because the executables need to run on the host. The include directory, which contains only source files, is specific to neither the host nor the target. The lib directory is specific to only the target architecture. Likewise, many of the tools in the Auxiliary directory are specific to the target architecture but not to the host.

Benefits of the new layout

We hope you can see that there are a lot of benefits to refreshing our compiler toolset layout on disk. As Visual C++ grows to include more scenarios like Android and iOS targeting we need to include more compiler toolsets. And as we release our tools more frequently we increase the chance that our developers might want to have multiple versions of the Visual C++ compiler tools installed side-by-side. This new layout is flexible and extensible and should (hopefully!) serve us for many years to come.

As in VS 2015, the Windows SDKs are not installed alongside the Visual C++ binaries, headers and libs. They are installing in the same location under the Program Files(x86) directory. Visual C++ SDKs (such as the DIA SDK) will continue to be installed alongside the VC++ toolset.

Drawbacks of the new layout

Even though change can be good, it’s still change. We know that a lot of people have scripts that are going to break with this layout change. We decided to do this with VS “15” as we also had to change the top-level directory to accommodate restrictions with the new installer. But any change can be a breaking change.

Please, please, please check out the scripts that you use and make sure you can migrate them to use the new layout. We want to know if you run into any problems. We want to know how hard the migration experience was for your code. Please leave comments on this blog post or send mail directly to our team at visualcpp@microsoft.com.

Finding the default MSVC tools

One last note: a lot of build systems need to find the default version of the Visual C++ tools. When you install Visual Studio it creates a file, %VCINSTALLDIR%\Auxiliary\Build\Microsoft.VCToolsVersion.default.txt, that contains the version string for the default toolset installed with VS. In a typical Preview 5 installation, %VCINSTALLDIR% would point to %Program Files(x86)%\Microsoft Visual Studio 15.0\Common7\IDE\VisualCpp.

You can parse this file with one extra line and variable in your command script:

@rem set BINDIR=get directory for x86-hosted, x86-targeting binaries
set /P VCTOOLS_VERSION=<"%VCINSTALLDIR%\Auxiliary\Build\Microsoft.VCToolsVersion.default.txt"
set BINDIR=%VCINSTALLDIR%\Tools\MSVC\%VCTOOLS_VERSION%\bin\HostX86\x86

Feedback

You’ll see a number of benefits from the new layout of the compiler toolset but we know that a lot of you will have to fix up scripts that you might not have looked at for years. We’re working on making this experience simple and smooth for everyone so please do reach out to us with details of your experience. If you have feedback on any part of this design please let us know in the comments below or by mailing visualcpp@microsoft.com. Thank you!

Presidential Debate #2: Watch Live on Bing

$
0
0
Just one month until Election Day, putting us that much closer to  casting a vote for the next President of the United States. Until then, the debates continue, with the next one happening Sunday, October 9 at Washington University in St. Louis, MO.
 
If you need to watch Clinton vs. Trump on your computer, prefer to use a second screen, or want to stream the debate on your phone, the Bing team will make sure don’t miss a moment of this must-watch television event.
 
Type “presidential debate video” into Bing or on the Bing mobile app to fire up two different live streaming options.
 
 
In the meantime, keep informed on the latest in the election by searching “2016 Presidential Election” on Bing for a view of the latest news, poll standings, tweets, and more.
 
-The Bing Team


Introducing the Windows Device Portal Wrapper project

$
0
0

With the release of the Windows 10 Anniversary Update came a new set of tools: the Windows Device Portal. Device Portal is a small web server baked into every Windows device that you can enable once you’ve turned on Developer Mode. We built Device Portal as the starting point for a new generation of diagnostic tooling for Windows – tools that work on all your devices, not just your desktop.

We recently released our Device Portal Wrapper project on GitHub and have now added it to NuGet. Our goal with the wrapper is to make it easy to build new tools on top of Device Portal. It wraps the Device Portal REST APIs in a managed C# layer, providing an object model for responses and an easy way to connect with the Device Portal on your device.

image1

Using your browser, you can access a variety of tools hosted on the device via the Device Portal Wrapper, each one a webpage backed by documented REST APIs. These tools include:

  • App installation, launch, and file management
  • Performance metrics, both all-up and per-process
  • Crash and live dump collection
  • ETW collection, both streaming and via WPR profiles
  • Networking information (ipconfig and profile management)
  • Platform-specific tools like Mixed Reality Capture on the HoloLens
  • More tools are being added, all the time

What can I use the wrapper for?

Currently, the wrapper supports the APIs that Device Portal users use most such as app management, performance metrics and the Isolated Storage explorer.  Additionally, most of the device-specific features are supported, like Mixed Reality Capture (record video of the real world + Holograms) on HoloLens and screenshots on the Xbox. For an example of how you can build with the wrapper, you can check out the sample apps included in the repo:

image2

Today the library can be used with either .NET 4.5.2+ or UWP. It can target any device operating on the Windows 10 Anniversary Update, as well as earlier Windows releases (10586) on IoT and HoloLens.

Coming up next

There are still a couple of REST APIs left to implement for our 1.0 release, which we’re currently working on. For 1.0, the wrapper will support all APIs across Core and each device family. Looking ahead, we want to support .NET Core so that you can use the wrapper from Linux as well.

In the future, the Device Portal team will be working to keep the wrapper up to date with new Device Portal REST APIs. We’re working hard to add new tools and features to Device Portal all the time, and we want to make sure that Wrapper stays up to date as well.

Device Portal <3 Open Source

The UI in Device Portal was made possible by SlickGrid, JQuery and Smoothie, among other great OSS libraries, so we’re no strangers to the awesome power of open source. One of our major design considerations in Device Portal was the use of a well-supported, documented protocol. We chose REST as every major programming language has an abundance of libraries to support communicating over REST with a server.  And pretty much as soon as Device Portal was released, we saw enterprising developers building apps and tools using those REST APIs.  So, we figured we’d help out and try to save everyone some time – thus the Wrapper project is MIT-licensed, and definitely accepting pull requests!

We can’t wait to see how developers use the Wrapper project and where they want to take it.  We love feedback, so always feel free to submit a GitHub Issue with any questions or ideas you might have. If you have any feedback for Device Portal itself, we keep a close eye on our UserVoice– we want to know what tools would make your life easier, so let us know.

Happy hacking!

Download Visual Studio to get started!

The Windows team would love to hear your feedback.  Please keep the feedback coming using our Windows Developer UserVoice site. If you have a direct bug, please use the Windows Feedback tool built directly into Windows 10.

Live architecture dependency validation in Visual Studio “15” Preview 5

$
0
0

In the past year, you told us that you considered removing unwanted dependencies to be an important part of managing your technical debt. The Layer designer enables you to validate architectural dependencies in your Visual Studio solutions. It first shipped in Visual Studio 2010, and is now part of Visual Studio Enterprise. But the experience could be improved. So, in Visual Studio “15” Preview 5, we are introducing a new Dependency Validation experience to help ensure that you, developers, respect the architectural constraints of the application as you edit your code.

Before presenting the new experience, let me first recap what the experience is in previous versions of Visual Studio Enterprise (Layer diagrams).

Previous experience: Layer validation in Visual Studio 2010-2015

Layer diagrams express architectural constraints

The screenshot below shows Visual Studio 2015 Update 3, where a layer diagram expresses the allowed dependencies between four layers. The blue rounded rectangles are layers associated with code elements; for example, here they represent assemblies, but they could be any set of code elements. The arrows express the permitted dependencies. You can also express additional constraints on each layer related to namespaces. For example, a property “Forbidden Namespace Dependencies” here indicates that the UI layer (selected on the diagram) should not depend on Owin (in the property window).

clip_image001

Validating the architecture before VS Dev “15”

To validate the architecture, you could either right-click on the diagram and chose “Validate Architecture”, or do the validation at build time. The former obliged you to remember to do it. The latter automatically catches architecture regressions during continuous integration.

This could be improved

To summarize a little: although this feature has existed for a while, it could definitively be improved:

Room for improvement in the authoring experience

– The authoring experience, in particular the creation of layer diagrams, was not very discoverable or usable, because the terminology was a bit obscure. In the screenshot above, few of you probably knew how to use ”Forbidden Namespaces”, or “Required Namespaces”. I was certainly confused myself.)

– The UX to create a layer diagram was not a simple process. You had to create a modeling project first, and then a layer diagram. And even the term “layer diagram” did not clearly express the intent, which is to validate dependencies.

Room for improvement in the developer experience

– The validation process itself was really slow. It could take several minutes for a medium sized solution, increasing build time considerably. In theory, this could have covered multiple languages, but in practice it only worked for C# and Visual Basic.

– Validation was, therefore, not well integrated into the developer’s inner loop, whereas you’d really want to know when you are breaking the architectural rules as soon as you do it.

– It did not work well with the newer features of the Error list. You could not filter by error code (as you’ll see in the screenshot below, there were none). You could not filter by document either, since all errors were treated as coming from the model file (the layer diagram file), and not from the offending source code file.

clip_image002

– Finally, when you double-clicked on a layer issue in the error list, the source code was presented in the text editor. However, because dependencies were extracted from binaries, the precise location of the validation issues was lost (there was no line number in the error list; the typical granularity was “in this method”. This required developer effort in order to pinpoint the issue).

The new “Dependency Validation” developer experience in VS “Dev15”.

Now that we share a common understanding of the gaps in the previous experience, let’s have a look at what is coming in Visual Studio “15”. We have been rethinking architecture dependency validation, and a first step is providing live validation. We’ve done this by re-implementing the validation logic as Roslyn analyzers that work against source code, provide precise information about issues, and benefit fully from the new features in the Error list and the editor.

Existing dependency validation diagrams: migration experience

When you open in Visual Studio Enterprise “Dev15” a solution that you created with a previous version of Visual Studio, you will see a gold bar in the Solution Explorer, telling you that you can benefit from live architectural validation.

clip_image003

When you press the “Update” button, projects in the solution are amended to enable live architectural validation. A NuGet package (Visual Studio Dependency Validation Analyzer) is added, which will enable validation at build time as well (for example, during continuous integration builds). Links to the Dependency Validation diagrams in the solution are also added. In Preview 5, you see these links in the solution explorer, but we are working on hiding them for RC.

Live validation

After the solution is updated, assuming you have enabled full solution analysis (Options | Text Editor | C# | Advanced | Enable Full solution analysis) you will see architectural issues starting to appear in the error list. If you don’t enable it, you will see the architectural issues in only the files you open, which might be what you want.

clip_image004

As with all Roslyn analyzers, these validation errors will appear immediately you introduce unwanted dependencies, and go away as you fix the code. Note that you no longer get a “somewhere in this method” error. Instead, erroneous code is precisely identified by squiggles in the editor, indicating what you need to change, with explanations in a tooltip.

Because we are now using the Roslyn framework, you should find the whole experience more familiar and consistent. You automatically get a better filtering experience in the Error List, and you are also able to manage the rules using rulesets – deciding on their severity, for example – and can manage violations using the standard suppressions mechanism.

What about the dependency validation authoring experience?

We have also changed the authoring experience to make it more discoverable and more accessible, changing the terminology from “Layer Diagram” to “Dependency Diagram”.

We have also:

– Added a command to directly create a Dependency Diagram
clip_image005

– Renamed the properties of a Layer in a Dependency Validation diagram, and their description, so that they are more meaningful

clip_image006

Limitations and feedback

You can try this experience now. What we released in VS “15” Preview 5 is a start, and we have more work to do, but we hope this will give you an idea of where we are heading.

Some particular issues to be aware of in Preview 5 that will be fixed before the final release are:

  • There is no progress feedback whilst projects are updated after pressing the Update button.
  • VB support is limited to namespace/naming rules only.
  • The “Architecture/New Dependency Diagram” top-level menu command shows an empty New Project dialog. Please use “File/New Project” to add a “Dependency Validation” project instead

As usual we’d love to hear your feedback. Don’t hesitate to send feedback directly from Visual Studio (Help | Send Feedback) to report a problem or provide a suggestion.

In Case You Missed It – this week in Windows Developer

$
0
0

Did you have a busy week this week? That’s ok, so did we.

In case you missed some of our updates, here is our weekly #ICYMI wrap up, featuring all of the blogs in a TL;DR format for your reading pleasure.

The UWP Community Toolkit Update Version 1.1

This week we released the first update to the UWP Community Toolkit based on your feedback. The update includes joining the .NET foundation, several new features, a sample app and even some documentation to get you started. Click the tweet below to read more!

Introducing the Windows Device Portal Wrapper

“Device Portal is a small web server baked into every Windows device that you can enable once you’ve turned on Developer Mode. We built Device Portal as the starting point for a new generation of diagnostic tooling for Windows – tools that work on all your devices, not just your desktop.”

Pretty cool, right? We can’t wait to see how developers start using the wrapper project and we’re eager to hear your feedback. Click the tweet below to learn more.

And that’s it! Stay tuned for more updates next week, and as always, please feel free to reach out to us on Twitter with questions and comments.

Have a great weekend!

Download Visual Studio to get started!

The Windows team would love to hear your feedback.  Please keep the feedback coming using our Windows Developer UserVoice site. If you have a direct bug, please use the Windows Feedback tool built directly into Windows 10.

Ignite Trip Report–Atlanta GA, Sept 26-30

$
0
0

Last week was I was at the Ignite conference in Atlanta and I was responsible for running the Developer Tools track. Let me tell you it was a FUN and crazy week. Here’s a tip when you run a track (content or otherwise): Wear tennis shoes!

Highlights

    1. The dev track general session with  Scott Hanselman drew over 1200 developers into the room, was live streamed with
      now over 16K views, and  generated a lot of buzz on Twitter
    2. Our track scored highest of the conference! We have a lot of great speakers and content :-)
    3. Our  booths location was fantastic and centered directly under the huge “Developer” section in the middle of the Microsoft Showcase, with a lot of foot traffic
    4. Our developer audience made up roughly 10% of the 23K attendees representative of  our biggest fans of Microsoft developer tools, particularly Visual Studio & .NET

      General session with Scott Hanselman

      clip_image002We had 15 jam packed demos and Scott was brilliant, hilarious and very entertaining while showing a whirlwind of practical demos across the Microsoft developer platform. It’s usually hard to please everyone with these overview sessions but he absolutely killed it. For the finale,
      Open Live Writer was published to the Microsoft Store using Centennial Desktop App Converter.

      You can watch the session here:  Review the Microsoft application platform for developers

      Break out Sessions – all on-demand

      Our track consisted of 2 full pre-days, 25 breakouts, 6 theater sessions and 9 interactive labs. Most breakout rooms were filled to capacity and many people were turned away at the door and directed to overflow viewing areas. This is a testament to the popularity and relevance of the sessions and speakers. You can also head to ignite.microsoft.com to see all of the the 718 (!) sessions, but I thought I would make it easy on you and put all the dev track sessions here if you missed them. I bolded my favorites. :-)
      1. Access data in .NET Core 1.0 with Entity Framework (Rowan Miller)
      2. Break out of the box with Python (Steve Dower)
      3. Build Angular 2 apps with TypeScript and Visual Studio Code (John Papa)
      4. Build cloud-ready apps that rock with open and flexible tools for Azure (Mikkel Mork Hegnhoj)
      5. Build connected Universal Windows Platform apps with .NET and Visual Studio (Daniel Jacobson)
      6. Build performance-obsessed mobile apps with JavaScript (Jordan Matthiesen)
      7. Create UI automated testing for iOS and Android Mobile Apps with Xamarin Test Cloud (James Montemagno)
      8. Develop, debug and deploy Containerized Applications with Docker (Glen Condron, Steve Lasker)
      9. Dig into C# and Visual Basic code-focused development with Visual Studio (Kasey Uhlenhuth)
      10. Dig into terabytes of your application logs with ad-hoc queries in Application Insights (Rahul Bagaria, Evgeny Ternovsky)
      11. Discuss cross-platform mobile development at Microsoft: Xamarin, Cordova, UWP and C++ (Panel) (John Papa, James Montemagno, Jordan Matthiesen, Ankit Asthana, Daniel Jacobson)
      12. Dive deep into ASP.NET Core 1.0 (Daniel Roth)
      13. Embrace DevOps for your next project with Visual Studio Team Services and HockeyApp (Donovan Brown, Joshua Weber)
      14. Explore cross-platform mobile development end-to-end with Xamarin (James Montemagno, Jason McGraw)
      15. Explore the new, cross-platform .NET Core 1.0 (Rich Lander)
      16. Explore web development with Microsoft ASP.NET Core 1.0 (Daniel Roth)
      17. Get an overview of the .NET Platform (Scott Hunter)
      18. Lead an autonomous DevOps team at Scale: a true story (Matthew Manela, Jose Rady Allende)
      19. Learn debugging tips and tricks for .NET Developers (Kaycee Anderson)
      20. Learn what’s new with Microsoft Visual C++ (Ankit Asthana, Kaycee Anderson)
      21. Manage modern enterprise applications with Microsoft Intune & HockeyApp (Thomas Dohmke, Clay Taylor)
      22. Maximize web development productivity with Visual Studio (Mads Kristensen)
      23. Monitor and diagnose web apps & services with Application Insights & SCOM (Mahesh Narayanan, Victor Mushkatin)
      24. Secure the enterprise with Microsoft Visual Studio Team Services (Rajesh Ramamurthy)
      25. Unlock the essential toolbox for production debugging of .NET Web Applications (Ido Flatow)

      And a few pictures…

      WP_20160927_15_45_43_Proclip_image001[6]WP_20160929_20_51_04_ProWP_20160929_12_28_25_ProWP_20160928_22_32_28_ProWP_20160927_15_47_33_ProWP_20160927_15_46_58_Pro

      Thank you everyone for all your hard work making this event a success.

      Enjoy!


      CppCoreCheck

      How to reference an existing .NET Framework Project in an ASP.NET Core 1.0 Web App

      $
      0
      0

      I had a reader send me a question yesterday. She basically wanted to use her existing .NET Framework libraries in an ASP.NET Core application, and it wasn't super clear how to do it.

      I have a quick question for you regarding asp.net core. We are rewriting our website using asp.net core, empty from the bottom up. We have 2 libraries written in .net 4.6 . One is our database model and repositories and the other is a project of internal utilities we use a lot. Unfortunately we cannot see how to reference these two projects in our .net core project.

      It can be a little confusing. As I mentioned earlier this week, some people don't realize that ASP.NET Core 1.0 (that's the web framework bit) runs on either .NET Core or .NET Framework 4.6aka "Full Framework."

      ASP.NET Core 1.0 runs on ASP.NET 4.6 nicely

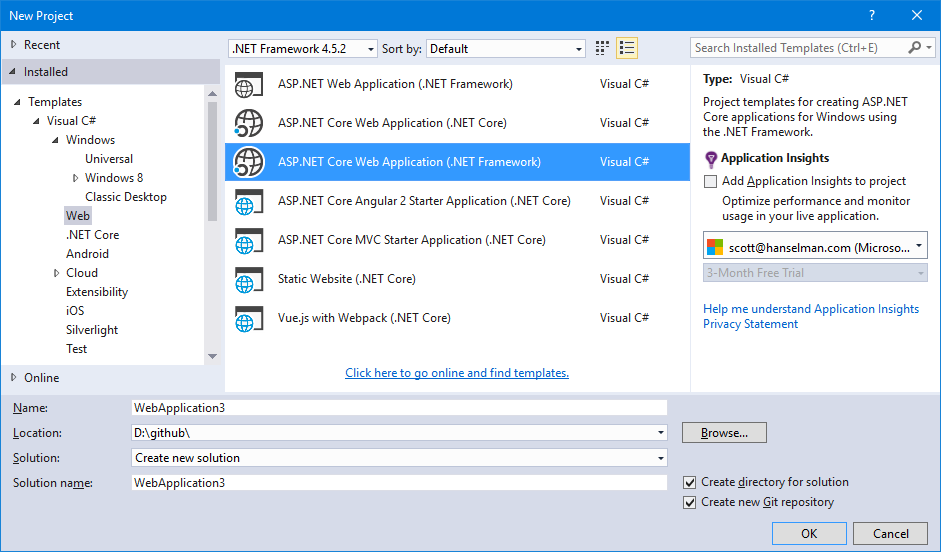
      When you make a new web project in Visual Studio you see (today) this dialog. Note in the dropdown at the top you can select your minimum .NET Framework version. You can select 4.6.2, if you like, but I'll do 4.5.2 to be a little more compatible. It's up to you.

      File New Project

      This dialog could use clearer text and hopefully it will soon.

      • There's the regular ASP.NET Web Application at the top. That's ASP.NET 4.6 with MVC and Web API. It runs on the .NET Framework.
      • There's ASP.NET Core 1.0 running on .NET Core. That's cross platform. If you select that one you'll be able to run your app anywhere but you can't reference "Full" .NET Framework assemblies as they are just for Windows.  If you want to run anywhere you need to use .NET Standard APIs that will run anywhere.
      • There's ASP.NET Core 1.0 running on .NET Framework. That's the new ASP.NET Core 1.0 with unified MVC and Web API but running on the .NET Framework you run today on Windows.

      As we see in the diagram above, ASP.NET Core 1.0 is the new streamlined ASP.NET  that can run on top of both .NET Framework (Windows) and .NET Core (Mac/Windows/Linux).

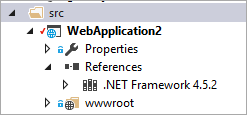
      I'll chose ASP.NET Core on .NET Framework and I'll see this in my Solution Explorer:

      Web App targeting .NET Framework 4.5.2

      I've got another DLL that I made with the regular File | New Project | Class Library.

      New Class Library

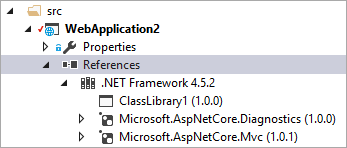
      Then I reference it the usual way with Add Reference and it looks like this in the References node in Solution Explorer. Note the icon differences.

      Adding ClassLibrary1 to the References Node in Solution Explorer

      If we look in the project.json (Be aware that this will change for the better in the future when project.json's functionality is merged with csproj and msbuild) you'll note that the ClassLIbrary1 isn't listed under the top level dependencies node, but as a framework specific dependency like this:

      {
      "dependencies": {
      "Microsoft.StuffAndThings": "1.0.0",
      "Microsoft.AspNetCore.Mvc": "1.0.1",
      },

      "frameworks": {
      "net452": {
      "dependencies": {
      "ClassLibrary1": {
      "target": "project"
      }
      }
      }
      }
      }

      Notice also that in this case it's a type="project" dependency in this case as I didn't build a NuGet package and reference that.

      Hope this helps!


      Sponsor: Big thanks to Telerik for sponsoring the blog this week! 60+ ASP.NET Core controls for every need. The most complete UI toolset for x-platform responsive web and cloud development. Try now 30 days for free!


      © 2016 Scott Hanselman. All rights reserved.
           

      .NET Framework Monthly Rollups Explained

      $
      0
      0

      We recently introduced the .NET Framework Monthly Rollup, a new and simplier way for you to install all applicable .NET Framework updates in a single step.

      This post describes the three monthly update types that you can install. It shows you what the install process looks like and addresses some common questions that we have heard since introducing the new model.

      The introduction of these new monthly releases aligns with a similar set of monthly Windows releases that you can also learn more about.

      Monthly Releases

      There are three kinds of updates that you can choose from. You can read the descriptions below to help you pick the best one for your situation.

      Security and Quality Rollup

      The Security and Quality Rollup is recommended for consumer and developer machines. It includes both security and quality improvements and is cumulative, meaning that it contains all of the updates from previous rollups. This makes it easy to catch up if you have missed any of the previous updates. The Security and Quality Rollup update will be made available on Windows Update and Windows Update Catalog.

      • When: Second Tuesday of the month (Patch Tuesday).
      • Where: Windows Update, Windows Server Update Services and Microsoft Update Catalog.
      • Cumulative: Yes.
      • Contents: Security and/or quality improvements.

      Security-Only Update

      The Security-Only Update is recommended for production machines. It contains only the security updates that are new for that month. This enables you to fine-tune the security updates that are applied. If you have installed the Security and Quality Rollup for the month, then you are up to date and do not need to install the Security-Only Update. The Security-Only Update will be made available on Windows Server Update Services and Microsoft Update Catalog.

      • When: Second Tuesday of the month (Patch Tuesday).
      • Where: Windows Server Update Services, Microsoft Update Catalog.
      • Cumulative: No.
      • Contents: Security improvements.

      Quality Rollup

      The Quality Rollup is recommended for large businesses that want to use and/or preview quality improvements as soon as they become available. These same quality improvements will typically be included in the following Security and Quality Rollup, approxiately three weeks later. The Quality Rollup will be made available on Windows Update, Windows Server Update Services and Microsoft Update Catalog.

      • When: Typically the Third Tuesday of the Month (one week after Patch Tuesday).
      • Where: Windows Update, Windows Server Update Services and Microsoft Update Catalog.
      • Cumulative: Yes.
      • Contents: Quality improvements.

      More Information

      The following information answers common questions.

      Supersedence

      The Security and Quality Rollup and Quality Rollup will contain all of the past updates for .NET Framework 4.5.x and 4.6.x that were released prior to this new model. They will not contain all past updates for .NET Framework 3.5 as those will be introduced naturally if/when new changes are necessary for those components.

      Supported .NET Framework Versions

      These new releases apply to supported .NET Framework versions. This means that you need to install a supported version of the .NET Framework to get these updates. At the time of writing, the supported versions are:

      • .NET Framework 3.5 SP1
      • .NET Framework 4.5.2 or later

      Supported OS Versions

      These new releases apply to Windows Vista SP2, Windows 7 SP1, Windows 8.1, Windows Server 2008 SP2, Windows Server 2008 R2, Windows Server 2012 and Windows Server 2012 R2.

      On Windows 10, these same .NET Framework security and quality updates are included in Monthly Windows Updates.

      Cadence

      We intend to ship updates monthly, however, we will only release updates if we have made changes. Also, some changes only apply to a subset of .NET Framework versions and/or Windows versions.

      Updating to a later .NET Framework

      These updates include patch-level changes. They will not upgrade the .NET Framework that is currently installed on your computer to a newer version. For example, if you have .NET Framework 4.5.2 but do not have 4.6.2, you will still not have .NET Framework 4.6.2 after installing one of these updates. If you want to upgrade to a later .NET Framework version, you must install it separately.

      Installation

      You will see a single item for each operating system:

      qualitysecurityrollup

      Security and Quality Rollup on Windows Server 2008 SP2

      securityonlyupdate

      Security-Only Update on Windows Server 2008 SP2

      Even though the Security and Quality Rollup appears as a single installation, it is possible to remove the rollup or security-only update for a specific version of the .NET Framework after the update has been applied. For example, if you installed the Security and Quality Rollup and you have .NET Framework 3.5 and 4.5.2 installed, you can uninstall the .NET Framework 3.5 Security and Quality Rollup, leaving only the .NET Framework 4.5.2 Security and Quality Rollup on your computer. This can be done by removing the Security and Quality Rollup that appears in Add or Remove Programs (ARP):

      SecurityOnlyARP

      Installed Security-Only Update on Windows Server 2008 SP2

      Cross-device experience with Project Rome

      $
      0
      0

      Overview

      Today we live in a multi-device world, and the way we use them spans different platforms and form factors: We read the morning news on our tablets, check email during the morning commute on our phones and at work on our desktop PCs. And at night, we watch movies on our home media consoles.

      The Windows platform targets devices ranging from desktop PCs, laptops and smartphones, to large-screen hubs, HoloLens, wearable devices, IoT and Xbox. The device landscape is further diversified with Android and iOS devices, emerging VR/AR solutions, and new IoT products. This heterogeneous environment provides the average user with many choices and device options.

      However, the tasks we perform on a daily basis (whether at home with family, or at work with colleagues) are not inherently device-centric, but rather human-centric. As we increase our device count and rely more on apps to run our lives, it is becoming more complicated to get things done.

      image1

      Project Rome is a platform for creating experiences that transcend a single device so they can harmonize across devices – empowering a developer to create human-centric scenarios that move with the user and blur the lines between their devices regardless of form factor or platform. This vision is beginning to take shape in the Windows 10 Anniversary Update (Windows 10, Version 1607) with the Remote Systems API, enabling developers to extend their app experiences across Windows devices connected proximally or through the cloud.

      This blog post covers the functionality of the Remote Systems API by walking through an example app experience built on Project Rome, and encourages developers to break down the barriers between devices to reduce friction and better serve your users’ needs.

      Contoso Music App

      Paul is a developer who has built a UWP app for streaming music. He has a growing user base and observes usage across a variety of Windows 10 devices. His telemetry shows installs occurring on phones, PCs and even Xbox. Identifying an opportunity, Paul sets out to a) reduce the friction of listening to music across these different devices and b) make it easier to get his app on other devices. Overall, he wants to ensure that his users can enjoy their great tunes all day, no matter where they are.

      Paul decides to create a scenario where users can transfer the current song they are streaming over to a new device. Sample scenarios include listening to music on your phone then after arriving home, transferring to your Xbox; listening on your work PC then transferring to your phone to go for a walk, etc. All the tools he needs are available from Project Rome, namely, the Remote Systems API.

      image2

      Discovering Devices

      The first step for Paul to introduce an effective cross-device experience is the discovery of other devices from the host device, and subsequent connection to the target device.

      Paul can implement device discovery over Wi-Fi and Bluetooth Low Energy (BLE) when the target device is in proximity, or via the Cloud. This discovery is provided by the RemoteSystemWatcher class, which selects the optimal transport given the scenario; the target devices do not require any special code implemented in order to be discoverable. Should he desire some advanced features for more targeted discovery, Paul can implement filters on RemoteSystemWatcher for discovery type, device type and availability status of the discovered devices. He can also connect to a device directly by IP address.

      Wrapping this functionality in a simple control within his app, the watcher is started when a user opens the control. RemoteSystemAdded events are fired when new devices are discovered (given they meet the filter conditions) and Paul can build a device list to populate the control with friendly device names for the user to select.

      image3

      Before connecting to a device, Paul must call the RequestAccessAsync() method to ensure his app is allowed to access remote devices (this is satisfied by declaring the “remoteSystem” capability in the application manifest). Once all conditions are met, connection is one click away and the doors are open for Paul to take his music experience across device barriers.

      image4

      Connecting and Launching an Experience

      Launching an app experience to a remote device is done using the RemoteLauncher.LaunchUriAsyncAPI (an existing API that has been extended to work across devices). Prior to launching, a connection is established by passing a RemoteSystem object into RemoteSystemConnectionRequest(). Paul leverages these APIs to specify the device the user has selected for connection, as well as to provide the payload required to launch the current song that was playing (using his “contosoapp:” protocol activation, also defined in the app’s manifest).

      image5

      He also provides a URI of his website, promoting the installation of his app to use as a fallback should the target device not have his app installed. Less than an hour after getting started, Paul wraps up his coding and starts preparing the update for shipping to his users.

      Messaging Between Connected Devices

      Several months later and pleased with both the user feedback on his app as well as the growing engagement and installs, Paul decides to further augment the user experience by implementing the ability to message between connected devices, enabling remote control experience for his music app. With Remote Systems already enabled, he can do this easily by leveraging app services on remote devices. Remote app services enable a foreground app on a host device to invoke application functionality on the target device (given the app is installed on the target).

      Paul already has a local app service in his app that allows other applications to control music playback; to enable remote functionality for his service, he simply adds <SupportsRemoteSystems=”true”> to his AppService element in the appx manifest. Next, in his app code that connects and launches to remote devices, he instantiates an AppServiceConnection object and creates a RemoteSystemConnectionRequest object for the target device, thereby opening a connection to an app service on the remote target device.

      After that, Paul is done with the heavy lifting and he now has a channel for sending and receiving messages to and from the app service – enabling him to create a companion experience for controlling music playback on the host device.

      image6

      image7

      Wrapping Up

      Project Rome breaks down barriers across all Windows devices and creates experiences that are no longer constrained to a single device. The Remote Systems API available in Windows 10 is a key piece of Project Rome that provides exposure of the device graph and the ability to connect and command – this is fundamental for driving user engagement and productivity for applications across all devices.

      Going forward, we are excited to continue building on our vision and collaborating with the developer community – our aim is to empower developers to enable compelling and productive experiences for users — no matter what device they are using.

      To learn more and browse sample code, including the snippets shown above, please check out the following articles and blog posts:

      Download Visual Studio to get started.

      The Windows team would love to hear your feedback.  Please keep the feedback coming using our Windows Developer UserVoice site. If you have a direct bug, please use the Windows Feedback tool built directly into Windows 10.


      .NET Framework Monthly Rollup: October 2016

      $
      0
      0

      Today marks the first release of the new .NET Framework Monthly Rollup. Here’s what went into the release:

      Security

      Microsoft Security Bulletin MS16-120 – Important: Security Update for Microsoft Graphics Component (3192884)

      This update resolves vulnerabilities in Microsoft Windows, Microsoft Office, Skype for Business, Silverlight, Microsoft Lync, and the Microsoft .NET Framework. The vulnerabilities could allow remote code execution if a user either visits a specially crafted website or opens a specially crafted document. This update addresses the vulnerabilities by correcting how the Windows font library handles embedded fonts. To learn more about the vulnerability, see Microsoft Security Bulletin MS16-120.

      Quality

      This release contains all of the quality updates shipped to date for the .NET Framework 4.x. These updates provides important reliability improvements, based on customer-reported issues. These updates have previously been called limited distribution release (LDR) updates, if you are more familiar with that term.

      The release does not contain quality updates for the .NET Framework 3.5.

      How to download the update

      The product improvements are available in two flavors:

      • Security and Quality Rollup (recommended for most users)
      • Security-Only Update

      The .NET Framework Security and Quality Rollup is available on Windows Update, Windows Server Update Services and Microsoft Update Catalog.

      The Security-Only Update is available on Windows Server Update Services and Microsoft Update Catalog.

      Viewing all 10804 articles
      Browse latest View live