Quantcast
Channel: Category Name
Viewing all 10804 articles
Browse latest View live

Test & Feedback – Capture your findings

$
0
0

Test & Feedback extension allows everyone in team, be it developers, testers, product owners, user experience, leads/managers etc. to contribute to quality of the application, thus making it a “team sport”. It enables you to perform exploratory tests or drive your bug bashes, without requiring predefined test cases or test steps. This extension simplifies the exploratory testing in 3 easy steps – capture, create & collaborate. An overview of this extension is captured in this overview blog of Test & Feedback extension.

In this blog, we will drill into the “Capture” aspect. There are two ways in which this extension captures the data:

  1. Explicit capture – With “explicit” capture, actions are required to be taken. All these actions are exposed on extension tool bar. We will cover – Capture Screenshot, Capture Notes and Capture Screen Recording in details below.
    Test & Feedback - Toolbar
  2. Implicit capture– With “implicit” capture, you are not required to do anything special. Actions triggered by you are automatically capturing required data with basic annotation added. These capture actions include – Image Action Log, Page Load Data and System Information.

Capture Screenshot

As you are exploring the web-app, you can capture the entire screen or part of screen as your screenshot. Click on [Test & Feedback - Capture Screenshot] to trigger screen capture. Take a “Fullscreen” or capture part of web page as required. Once it is selected, you can annotate the captured screenshot.

Test & Feedback - Annotated Screenshot

You can select the name of the screenshot you like, and also can use shapes from annotation toolbar to draw on cropped image area to show/highlight part of the page. Annotation toolbar provides – drawing, circles/ovals, rectangles, arrows, and add text annotations. It also provides way to “blur” part of image that has some confidential/sensitive information. You can customize the color for all shapes. Save the screenshot by clicking on [Test & Feedback - Save screenshot]. Saving a screenshot will add it automatically to the session and also shows up on the session timeline.

NoteAll floating elements like tooltips, and dynamic UI components that show up on mouse hover and go-away when mouse is moved away, are not captured using the “screenshot” option. You could instead use the “screen recording” option mentioned below.

Capture Notes

Notes can be taken or made as you explore your web-app. Click on [Test & Feedback - Capture notes] to open notes area where notes can be added and saved. Notes are saved with the session timeline. You can even paste “text” from your clipboard into notes area. Notes taken are automatically saved, and are persisted even if browser window closes, or the extension pop-up closes. “Save” the note to add it to the ongoing session.

Test & Feedback - Capture notes screenshot

Screen Recording

Screen recording allows you to capture more continuous activity of web-page navigation. It is only “video” capture, and “audio” capture is not supported. It also addresses scenario where capturing more events than what image action log can capture or capturing floating elements in web-page (like tooltips) is required. Screen recording can also record the data for all desktop (non-browser) applications as well. This is extremely useful if you are testing a desktop app, but still use the extension to report issues using the screen recording.
Click on [Test & Feedback - Record Screen] to start the recoding, and stop recording.

  1. Start recording
    Test & Feedback - Start screen recording
  2. Select screen or application to record
    Test & Feedback - Select screen to record
  3. Ongoing screen recording status will appear
  4. Stop the recording when done
    Test & Feedback - Stop screen recording

Capture Image action log

As you are navigating the web-app, all your mouse clicks, keyboard typing events and touch gestures are captured automatically in the form of “image action log” to give you more context of repro-steps or actions that lead to some specific part of the web-app. Image action log data tracks last 15 events in the context of the ongoing session. Information about captured image action log events is made available during bug and task creation, as well as test case creation. This helps in knowing the steps that led to the bug with just one click at the time of filing it.

Test & Feedback - Image action log screenshot while filing bug

A check-box option allows to include or exclude image action log data during bug filing/task creation. Image action log capture is turned on with the install of extension. Extension “Options” page enables configuration of the image action log option.

In work item form, all image action log images are shown in compact form, but also a full resolution image is added with bug or task for getting complete context. These images are accessible via quick links added in bug repro steps or task description.

Test & Feedback - Image action log view in work item
Image action view in work item

They can be seen by clicking on attachment as well.
Test & Feedback - Image action attachments in work item
Image action attachments in work item

Capture Page Load Data

Just like the “image action log” captured your actions performed on a web-app being explored, in form of images in the background, the “page load” functionality automatically captures details for a web page to complete the load operation. Instead of relying on subjective/perceived slowness of web page load, you can objectively quantify the slowness in the bug now. Web page load data provides high level snapshot while filing the bug and a more detailed drilldown with timeline graphs added at navigation and resource level in filed bug/task.

Test & Feedback - Page load data

Snapshot provides high level information on where the maximum time is spent while loading the page. A detailed report is attached with bug which comprises of Navigation Chart and Resource Chart. A developer will find this information very useful to get started with deeper investigations about performance issues about web-app.

Test & Feedback - Page load data - developer view

Option exists with bug and task form to exclude adding page load data when not needed. Also, see extension “Options” to enable or disable this option across of sessions.

System Information

With every bug, task and test case filed, “System information” about the browser and machine is added. It captures browser, OS, memory and display information. This helps developer know the config of machine, display properties and OS info to debug issues. This additional diagnostics information is always sent and cannot be turned off.

Test & Feedback - System Information

Options

Settings are exposed for all of the above capture sources to enable or disable them at extension level across of all sessions.

Test & Feedback - Options

Now that you are familiar with all capture ways in Test & Feedback extension, we will explore next on how can captured data be used in various “Create” [coming soon] options to create artifacts like bugs, tasks, and test cases.


Maven and Gradle build tasks support powerful code analysis tools

$
0
0

Over the last few months we have been steadily building up the capabilities of the Maven and Gradle build tasks to offer insights into code quality through popular code analysis tools. We are pleased to announce additional much-requested features that we are bringing to these tasks, which will make it easier to understand and control technical debt.

Maven Code Analysis fields

Continuous Integration builds: SonarQube integration feature parity with MSBuild

Back in July, our Managing Technical Debt planning update for 2016 Q3 announced a plan to support SonarQube analysis in Java to a level that is equivalent with our strong integration for MSBuild. This is well underway and nearing completion: both Maven and Gradle can now perform SonarQube analysis by selecting a checkbox in the build definition. This will create a build summary of issues that are detected.

We also added the option to break a build when SonarQube quality gates fail. This gives instant feedback and helps you stop the technical debt leak. Finally, there is a new build summary that provides detailed information from SonarQube on why the quality gate failed so that it is easy to identify problems. You can then drill-down and get even more data by navigating to the SonarQube server through the link provided.

SonarQube Build Breaker

Broader support for Java-based static analysis tools

We understand that in the past we lacked integration features for some standalone code analysis tools that are widely used. We have heard your feedback and have added support for three such tools: PMD, Checkstyle and FindBugs. You can enable them simply and quickly through a checkbox in the “Code Analysis” section of your build configuration, and they will run on any agent whether through the Hosted agent pool or on a dedicated agent of your choice (Windows, Linux or Mac!).

Code Analysis Report

Towards Full Parity Java/MSBuild: Pull Request with Code Analysis for Java

For some time we have supported showing you code analysis issues directly on pull requests in Visual Studio Team Services for projects using MSBuild. We hope to support this for Maven and Gradle builds too in future.


Limitations, Feedback, and Troubleshooting

If you are working on-premise with TFS 2016, FindBugs support for Gradle will not ship at RTM but will be added in Update 1. For users on Visual Studio Team Services, most of these features are already live and waiting for you, with the rest due to roll out as part of Sprint 107 in the next few weeks.

As always, we would love to hear from you. Please raise issues and suggestions on the issues tab of the vsts-tasks repository in GitHub: https://github.com/microsoft/vsts-tasks/issues and add the label “Area: Analysis”.


Reduced Out of Memory Crashes in Visual Studio “15”

$
0
0

This is the third post in a five-part series covering performance improvements in Visual Studio “15” Preview 5. The previous 2 posts talked about faster startup, and shorter solution load times in Visual Studio 15″.

Visual Studio is chock-full of features that millions of developers rely on to be productive at their work. Supporting these features, with the responsiveness that developers expect, consume memory. However, in Visual Studio 2015, in certain scenarios the memory usage grew too large. This led to adverse impact such as out-of-memory crashes and UI sluggishness. We received feedback from a lot of customers about these problems. In VS “15” we are tackling these issues while not sacrificing the rich functionality and performance of Visual Studio.

While we are optimizing a lot of feature areas in Visual Studio, this post presents the progress in three specific areas – JavaScript and TypeScript language services, symbol loading in the debugger, and Git support in VS. Throughout this post I will compare the following two metrics for each of the measured scenarios, to show the kind of progress we have made:

Peak Virtual Memory: Visual Studio is a 32bit application, which means the virtual memory consumed can grow up to 4GB. Memory allocations that cause total virtual memory to cross that limit will cause Visual Studio to crash with an “Out of memory” (OOM) error. Peak Virtual Memory is a measure of how close the process is to the 4GB limit, or in other words, how close the process is to crashing.

Peak Private Working Set: A subset of the virtual memory which contains code that the process executes or data that the process touches, needs to be in physical memory. “Working set” is a metric that measures the size of such physical memory consumption. A portion of this working set, called “Private Working Set”, is memory that belongs to a given process and that process alone. Since such memory is not shared across processes, their cost on the system is relatively higher. Measurements in this post report the peak private working set of Visual Studio (devenv.exe) and relevant satellite processes.

JavaScript language service

Over a third of Visual Studio developers write JavaScript (JS) on a regular basis, making the JS language service a component that is loaded in a significant number of Visual Studio sessions. The JS language service provides such features as IntelliSense, code navigation, etc., that make JS editing a productive experience.

To support such productivity features and to ensure they are responsive, the language service consumes a non-trivial amount of memory. The memory usage depends on the shape of the solution, with project count, file count, and file sizes being key parameters. Moreover, the JS language service is often loaded in VS along with another language service such as C#, which adds to the memory pressure in the process. As such, improving the memory footprint of the JS language service is crucial to reducing the number of OOM crashes in VS.

In VS “15”, we wanted to ensure Visual Studio reliability is not adversely impacted by memory consumption regardless of the size and shape of the JS code. To achieve this goal without sacrificing the quality of the JavaScript editing experience, in VS “15” Preview 5 we have moved the entire JS language service to a satellite Node.js process that communicates back to Visual Studio. We have also merged the JavaScript and TypeScript language services, which means we achieve net memory reduction in sessions where both language services are loaded.

To measure the memory impact, we compared Visual Studio 2015 Update 3 with VS “15” Preview 5 in this scenario:

  • Open WebSpaDurandal solution. This is an Asp.Net sample, which we found to represent the 95th percentile in terms of JS code size we see opened in VS.
  • Create and enable auto syncing of _references.js
  • Open 10 JS files
  • Make edits, trigger completions, create/delete files, run the format tool

Here are the results:

Chart 1: Memory usage by the JavaScript language service

Peak virtual memory usage within Visual Studio is reduced by 33%, which will provide substantial relief to JS developers experiencing OOM crashes today. The overall peak private working set, which in Preview 5 represents the sum of the Visual Studio process and our satellite node process, is comparable to that of Visual Studio 2015.

Symbol loading in the debugger

Symbolic information is essential for productive debugging. Most modern Microsoft compilers for Windows store symbolic information in a PDB file. A PDB contains a lot of information about the code it represents, such as function names, their offsets within the executable binary, type information for classes and structs defined in the executable, source file names, etc. When the Visual Studio debugger displays a callstack, evaluates a variable or an expression, etc. it loads the corresponding PDB and reads relevant parts of it.

Prior to Visual Studio 2012, the performance of evaluating types with complex natvis views, was poor. This was because a lot of type information would be fetched on demand from a PDB, which would result in random IOs to the PDB file on disk. On most rotational drives this would perform poorly.

In Visual Studio 2012, a feature was added to C++ debugging that would pre-fetch large amounts of symbol data from PDBs early in a debugging session. This provided significant performance improvements when evaluating types, by eliminating the random IOs.

Unfortunately, this optimization erred too much on the side of pre-fetching symbol data. In certain cases, it resulted in a lot more symbol data being read than was necessary. For instance, while displaying a callstack, symbol data from all modules on the stack would get pre-fetched, even though that data was not needed to evaluate the types in the Locals or Watch windows. In large projects having many modules with symbol data available, this caused significant amounts of memory to be used during every debug session.

In VS “15” Preview 5, we have taken a step towards reducing memory consumed by symbol information, while maintaining the performance benefit of pre-fetching. We now enable pre-fetching only on modules that are required for evaluating and displaying a variable or expression.

We measured the memory impact using this scenario:

  • Load the Unreal Engine solution, UE4.sln
  • Start Unreal Engine Editor
  • Attach VS debugger to Unreal Engine process
  • Put Breakpoint on E:\UEngine\Engine\Source\Runtime\Core\Public\Delegates\DelegateInstancesImpl_Variadics.inl Line 640
  • Wait till breakpoint is hit

Here are the results:

Chart 2: Memory usage when VS Debugger is attached to Unreal Engine process

VS 2015 crashes due to OOM in this scenario. VS “15” Preview 5 consumes 3GB of virtual memory and 1.8GB of private working set. Clearly this is an improvement over the previous release, but not stellar memory numbers by any means. We will be continuing to drive down memory usage in native debugging scenarios during rest of VS “15” development.

Git support in Visual Studio

When we introduced Git support in Visual Studio, we utilized a library called libgit2. For various operations, libgit2 maps the entire git index file into memory. The size of the index file is proportional to the size of the repo. This means that for large repos, Git operations can result in significant virtual memory spikes. If VS was already under virtual memory pressure, these spikes can cause OOM crashes.

In VS “15” Preview 5, we no longer use libgit2 and instead call git.exe, thus moving the virtual memory spike out of VS process. We moved to using git.exe not only to reduce memory usage within VS, but also because it allows us to increase functionality and build features more easily.

To measure the incremental memory impact of a Git operation, we compared Visual Studio 2015 Update 3, with VS “15” Preview 5 in this scenario:

  • Open Chromium repo in Team Explorer
  • Go to “Changes” panel to view pending changes
  • Hit F5 to refresh

Here are the results:

Chart 3: Incremental memory usage when “Changes” panel in Team Explorer is refreshed

In VS 2015, the virtual memory spikes by approximately 300MB for the duration of the refresh operation. In VS “15”, we see no measurable virtual memory increase. The incremental private working set increase in VS 2015 is 79MB, while in VS “15” it is 72MB and entirely from git.exe.

Conclusion

In VS “15” we are working hard at reducing memory usage in Visual Studio. In this post, I presented the progress made in three feature areas. We still have a lot of work ahead of us and are far from being done.

There are several ways, you can help us on this journey:

  • First, we monitor telemetry from all our releases, including pre-releases. Please download and use VS “15” Preview 5. The more usage we have with external sources in day to day usage scenarios, better the signal we get and that will immensely help us.
  • Secondly, report high memory (or any other quality) issues to us using the Report-a-problem tool. The most actionable are reports that help us reproduce the issues at our end, by providing us with sample or real solutions that demonstrate the issue. I realize that is not always an option, so the next best are reports that come attached with a recording of the issue (Report-a-problem tool lets you do this easily) and describe the issue in as much detail as possible.
Ashok Kamath, Principal Software Engineering Manager, Visual Studio

Ashok leads the performance and reliability team at Visual Studio. He previously worked in the .NET Common Language Runtime team.

How to develop augmented reality apps with Vuforia for Windows 10

$
0
0

Augmented Reality is a way to connect virtual objects with the real world, making it possible to naturally interact with them by use of mobile devices like phones, tablets or new mixed reality devices like HoloLens.

Vuforia is one of the most popular Augmented Reality platforms for developers, and Microsoft partnered with Vuforia to bring their application to the Universal Windows Platform (UWP).

Today, we will show you how to create a new Unity project and develop a real AR experience from scratch for devices running Windows 10.

image1

You can download the source for this application here, but I encourage you to follow the steps and build this yourself.

As we’ve noted, augmented reality is the creation of a connection between the real world around you and a virtual world. One of the ways to make this connection is to use real objects like cards or magazines, and then connect them with virtual objects rendered on a digital interface.

What are we going to develop?
This article consists of two parts. In Part 1, we will get you up and running with Vuforia, an augmented reality SDK. This includes creating an account, configuring it and getting the SDK. In Part 2, we will develop an app that detects the front cover of a boating magazine, then render the boat on the front cover in 3D. You can then look around the boat and see it from all different angles.

Part 1: Getting started with Vuforia 6

The first thing we need is an account at https://developer.vuforia.com/.

This is needed so we can get the free license key as well as a place to upload our markers. A marker can be any image, and is used by Vuforia to connect a real world object with our virtual world. In this article, we will use one marker – an image of the font cover of a magazine.

You can download this front cover here:

image2

1) Creating a license
After logging in click Develop, then Add License Key:

image3

This will take you to a form where you can set the details of this license. They can be changed and removed later.

Fill it out like this, using your own application name:

image4

2) Creating our markers
Now that we have a license, we can go ahead and create our markers. All of the markers can be added to a single database. Still in the Develop tab, click Target Manager and Add Database:

image5

Fill out the form that pops up. It is needed to create a database for our markers. This database will be downloaded and added to your app locally – on the device itself – so select Device as the database type:

image6

Once created, click the MagazineCovers entry in the database list to open it:

image7

Now we are ready to add the targets. In the MagazineCover database view, Click Add Target:

image8

A new form will show, where you will need to select the image you want to use, its width and a name. Select the magazine front cover I provided earlier, set the width to 8.5 and name it cover1. Click Add to upload it and generate a marker:

image9

Once uploaded, you will see it in the database view:

image10

Done! Next, we will create a new Unity project and add the Vuforia SDK to it.

3) Creating a new Unity Project

If you don’t have Unity yet, you can go ahead and download it here: http://unity3d.com/. A free personal license is available.

Start Unity, and from the project creation wizard, ensure 3D is selected and name the project “MagAR”:

image11

Then click Create project.

4) Downloading the Vuforia SDK

When the project is created, we need to import the Vuforia SDK for Unity package. It can be downloaded from here (take the latest version): https://developer.vuforia.com/downloads/sdk

image12

Once downloaded, you can simply double-click the packaged file to import it to your solution:

image13

Once extracted, a popup like this will show. Click Import to add the Vuforia SDK to your project. Your solution should look something like this:

image14

5) Adding our Marker Database to our project

Now that we have the Vuforia SDK installed, the last thing we need to do is to add the marker database we created earlier to our project.

Go back to the Vuforia Developer portal, and click the Download Database (All) button from your MagazineCover database:

image15

Select the Editor as the development platform and click Download:

image16

Once compiled and downloaded, you can just open the Unity package file to import it to your project:

image17

You can see from the import dialogue that we got the cover marker, as well as the database itself. Click Import and you are all set to start developing!

Your solution should look something like this:

image18

Part 2: Developing the app!

Now that we have the Vuforia SDK installed as well as the markers we need, the fun can begin.

Vuforia comes with a set of drag and drop assets. You can take a look at them in the Vuforia/Prefrabs folder as seen below:

image19

Vuforia uses a special camera called ARCamera, highlighted above, to enable tracking of markers. Every Vuforia project will need this. This special camera has a lot of settings and configuration possibilities (which we’ll take a look at shortly), and will be able to detect real world objects using, in this case, the front cover of a magazine. Vuforia will then place a virtual anchor on the cover so we can get its virtual position and orientation for use in our virtual world.

Another thing we will need is the target itself. This is the prefab named ImageTarget, and it is also configurable. Let’s go ahead with the development.

1) Adding the ARCamera to our scene and configuring it

a) Add camera
From the Vuforia/Prefabs folder, drag and drop the ARCamera prefab into your scene to add it. You can delete the GameObject called Main Camera from the scene since we want to use the ARCamera as our view into the scene instead:

image20

Next, click the ARCamera prefab to see its properties in the Inspector. This component is the heart of your application and requires some simple setup. The first thing it needs is your app’s License Key.

b) Getting license key
Go to the Vuforia Developer Portal, select your license and copy the entire Vuforia License key from that gray box in the middle of the screen:

image21

c) Setting license key
Next, in the ARCamera inspector, paste the license key to the App License Key box:

image22

d) Setting how many images to track
Another setting we want to verify is the Max Simultaneous Tracked Images setting – we want to have one cover magazine on the table at a given time, so make sure this is set to 1. This can be changed based on your needs:

image23

e) Setting world orientation
Next we want to make sure that we orient the world around our camera, so set the World Center Mode to CAMERA to achieve this:

image24

f) Loading our database
We also want to load and activate the Magazine Covers database, so tick the Load Magazine Covers, and activate it. 

image25

g) Testing the ARCamera
At this point, we should be able to test our ARCamera – it won’t take any virtual actions but, if set up properly, we should be able to see the output from the web camera.

To test, click the play button on top of the scene view. You should be able to see what the camera sees and the Vuforia watermark:

image26

2) Adding our first basic marker

Markers are added to your scene using the ImageTarget prefab. These can then be configured to your liking, as well as selecting what marker it will use for detection. In Unity, each item added to your scene is a GameObject – think of this as your base class. Each GameObjects in your scene can have multiple children and siblings.

The way an ImageTarget works is that it can have child GameObjects and, once the magazine cover is detected, these child GameObjects will become visible. If the card isn’t detected, the children will be hidden.

a) Adding an ImageTarget
Adding an ImageTarget is as simple as adding an ARCamera, just drag and drop the prefab to the scene hierarchy view:

image27

b) Configuring the ImageTarget
We now need to configure which marker the ImageTarget will use. Select the ImageTarget and view its properties. Find the Database and Image Target properties.

First, set the Database to MagazineCovers, then set the Image Target to cover1:

image28

You can see that it automatically populated some of the fields.

c) Spawning a boat on top of the marker!
Now – let’s spawn a boat on top of the marker! I purchased a nice boat from the Unity Asset Store. There are other boats available that may be free: https://www.assetstore.unity3d.com/en/#!/content/23181

Navigate to the folder for your asset, then drag it (or its prefab) onto the ImageTarget so it becomes a child of the ImageTarget.

image29

Then, position/scale the boat so it fits on top of the ImageTarget (the magazine cover).

Looking at the scene view, you can now see the magazine cover with the boat on top of it:

image30

d) Testing if it spawns
Let’s go ahead and run the app again. Place the magazine on the playfield (in front of the camera) and the yacht will become visible on top and will track if you move the marker.

e) Adding details
You can add even more things to the scene, like water, and can change the lighting so your scene becomes more realistic. Feel free to play around with it.

3) Exporting as a UWP

Getting your experience running on a Windows 10 device will make the experience even better, since your tablet has the ability to easily move.

To export the solution from Unity, go to File -> Build Settings:

image31

From this dialogue, set the Platform to Windows Store and the SDK to Universal 10 and click Build. A new dialogue will ask you to select a folder to export to; you can create a new one or select an existing one – it’s up to you. Once the export is done, a new UWP Solution is created in the selected folder.

Go ahead and open this new solution in Visual Studio 2015.

4) Testing the app

Once Visual Studio 2015 has loaded the solution, set the Build Configuration to Master and the Platform to x86, and build and run it on your local machine:

image32

Verify that the application is running and working as it should.

5) Adding a simple UI using XAML

Let’s also add a simple user interface to the app using XAML. To do this, open the MainPage.xaml file from the project tree and view the code. It should simply consist of a SwapChainPanel with a Grid in it, like so:

You might also want to decorate the screen with a logo and some lines to make the UI look neat and clean. To do this, we need a file from the downloadable source (/Assets folder) called SunglobePatrick26x2001.png. Add this to your solutions Assets folder.

Next, change your XAML code to be similar to this:


Next, change your XAML code to be similar to this:

What we’re doing here is using the XAML tags to add two rectangles, used as lines, for a minimalistic UI, as well as adding the logo for the boat.

Run the app again to see the UI on top of your rendering canvas:

image33

That’s it! You now know how to develop AR applications for Windows 10 devices!

Wrapping up

To sum up, we created an AR experience for Windows 10 with the following simple steps:
1) Create an account at the Vuforia Developer Portal
2) Acquire a license
3) Created a Unity project using the Vuforia SDK
4) Exporting the Unity project as a UWP app for Windows 10
5) Added a simple UI using XAML

Download Visual Studio to get started.

The Windows team would love to hear your feedback.  Please keep the feedback coming using our Windows Developer UserVoice site. If you have a direct bug, please use the Windows Feedback tool built directly into Windows 10.

New navigation, Test & Feedback extension GA, and cherry-pick – Oct 12

$
0
0

New navigation, Test & Feedback extension GA, and cherry-pick – Oct 12

Last Updated: 10/12/2016

Note: The improvements discussed in this post will be rolling out throughout the next week.

We have a lot of new features rolling out this sprint!

New navigation experience is On by default

In mid-August, we enabled an opt-in mode allowing customers to preview our new navigation experience as detailed by Brian Harry on his blog. We’ve collected feedback and made refinements since then, preparing the feature for broad availability. I am happy to announce that with this sprint’s deployment, we will be defaulting to the new navigation experience on all accounts. We’ve made this decision based on the following data:

  • 93% of users that opted into the new nav did not return to the previous version, aligning with the positive user feedback we received
  • 30%+ of the web traffic is now serving the new nav, and this number continues to grow. This gives us both confidence on quality and significant coverage of use cases
  • Since the opt-in release, over 20 usability and bug fixes have reported by users and all have been addressed

The most constructive feedback we have received is that users want to manage this change, and we need to be respectful of that. In this sprint, we are still allowing users to opt out of the new experience. This provides admins and users with a window to prepare and accommodate their teams for the change. Our current plan is to remove the previous nav next sprint, and continue to innovate our navigation using the new navigation experience as the base going foward.

Cherry-pick and revert

We’ve added two new features that make it easier to port or back out changes from the web portal: Cherry-pick and Revert.

Use the cherry-pick command to port changes in a pull request to multiple branches. A typical use case is when a bug needs to be hotfixed, but should also be fixed in the mainline. Once you’ve created your pull request that contains the fix to the hotfix branch, you can easily cherry-pick the same fix into the master branch. If the PR is active, you can find the Cherry-pick command on the context menu.

cherry pick

If you want to cherry-pick a change from a completed PR, the command will appear alongside the completion message.

cherry pick pull request

In both cases, you’ll be directed to an experience that applies the change to a new branch and sets up the PR.

cherry pick dialog

You can revert changes on completed PRs. Find the PR that introduced the bad change, click Revert, and follow the steps to create a PR that backs out the unwanted changes.

revert

If you have ideas on things you’d like to see, head over to UserVoice to add your idea or vote for an existing one.

Commit page improvements

We are making the user experience of the commit details page and commit history page modern and highly performant. You will be able to find and act on important information related to the commit at a bird’s-eye view.

commit details

commit history

Configurable compare branch

You can now set your compare branch to something other than the default branch. This setting will be remembered on a per-user basis. Pull requests and new branches created from the Branches page will be based off the branch you set as the compare branch.

Your default branch will automatically be set as the compare branch as denoted by the badge.

default compare

You can change the compare branch by selecting Set as compare branch in the context menu.

set compare

You will then see the compare branch appear at the top of your Mine and All views.

compare

Find a file or folder

You can quickly search for a file or folder in a repository using the Code hub in your Team Services project. The result lists items from your current folder followed by files and folders across the repository.

For any Git repository, go to the path control box, and start typing to initiate a navigation search experience for the file or folder you are looking for.

find files

For those of us who love keyboard shortcuts, we added the functionality in the Code / Files view to launch the Find a File experience by just hitting “t” on any repos Files view. With the up/down arrows, you go up and down the results, click or press Enter to open a result, or with Esc, you close the Find a File experience.

find file shortcuts

Suggested value in work item pick lists

Custom picklist fields can be configured to allow users to enter their own values beyond the provided list values in the picklist field.

This feature also enables users to use picklist fields with the multi-value control extension available in the marketplace.

Xcode 8 signing and exporting packages in the Xcode Build Task

The Xcode task now supports building your projects using Xcode 8 automatic signing. You can install the certs and provisioning profiles on the build server manually, or have the task install them by specifying the File Contents options.

Xcode signing

Xcode 8 requires specifying an export options plist when exporting an app package (IPA) from an archive (.xcarchive). The Xcode task now automatically identifies the export method if you are using Xcode 8 or Xcode 7. You can specify the export method or specify a custom plist file from the Xcode task. If you are using an Xcode version older than Xcode 7, the task falls back to using the old tool (xcrun) for creating the app package.

Xcode export

FindBugs in the Gradle build task

You can now request FindBugs standalone static analysis in the Gradle build task (in addition to the PMD and Checkstyle analysis). The results of the static analysis appear in the build summary, and resulting files are available from the Artifact tab of the build result.

Build improvements

Visual Studio “15” build task

The Visual Studio Build and MSBuild tasks can now locate Visual Studio “15” installations. You no longer need to explicitly specify the path to MSBuild.exe 15.0 in your build configuration.

git-lfs and shallow clone

The 2.107.x build agent now supports Git shallow clone and git-lfs. More details are at https://www.visualstudio.com/en-us/docs/build/define/repository.

Updated hosted build pool

The hosted build pool has been updated:

  • Azure SDK 2.9.1
  • WIX 3.10
  • SQL lite for Windows Phone 8.1
  • Xamarin Stable Cycle 8 SR 0
  • Windows 10 SDK 14393
  • .NET 4.6.2
  • Git 2.10.1

You can now search for builds in the Mine and Queued tabs.

Email support for AAD groups

This feature enables you to @mention and receive emails from AAD groups which you are in.

AAD email

Multiple schedules in releases

Want to schedule your releases to be created more than one time in a day? You can now configure multiple scheduled triggers in a release definition.

release schedule

Azure resource group improvements

Currently, when using the Azure resource group task, there is no way to validate if the ARM template is syntactically correct and would be accepted by the Azure Resource Manager without actually deploying the resources. This enhancement allows a new deployment mode called Validation Only where users can find problems with the template authoring before creating actual Azure resources.

Another enhancement to the Azure resource group task is to allow either incremental or complete deployments. Currently, the task deploys the ARM templates using the Incremental mode. Incremental mode handles deployments as incremental updates to the resource group. It does not modify resources that exist in the resource group but are not specified in the template. Complete mode deletes resources that are not in your template. By default, incremental mode is used.

resource groups

Azure CLI task

The new Azure CLI task supports running Azure CLI commands on cross platform agents like Windows, Linux and Mac. The task supports both Classic and ARM subscriptions. It supports two modes of providing the script, one as a linked artifact and another as an inline script.

cli

Simplified Azure endpoint creation

In an earlier sprint, we made it easier to create a new Azure Resource Manager service endpoint from Team Services. That experience only worked in accounts that are backed by an Azure Active Directory. In this deployment, we are bringing the same simplified experience for all the other accounts that are not backed by an AAD. So, if you are a MSA user and have an Azure subscription that you would like to deploy to from Team Services, you can create an Azure endpoint without having to run tedious Powershell scripts or following a blog.

Azure endpoint

Test & Feedback extension general availability

We are pleased to announce that Exploratory Testing extension is now Test & Feedback extension and is free for all. You can find more information in the blog post.

Testing improvements

Update existing bugs from Web Runner

In addition to creating new bugs from the Web runner, now you can also update an existing bug. All the diagnostic data collected, repro steps, and links for traceability from the current session are automatically added to the existing bug.

test runner

Test hub contribution point

We have added a new contribution point (“ms.vss-test-web.test-plan-pivot-tabs”) within the Test plan hub to allow developers to write extensions as a pivot tab, that appears next to the Tests and Charts tab.

contribution point

Thanks,

Jamie Cool

VS Team Services Update – Oct 12

$
0
0

Before I get to talking about this update let me talk about a change in the way we are announcing updates…

It takes a while for an update to roll out across the entire service.  That is by design and it is part of our strategy to control the damage from any bugs we miss in the testing process.  Our deployment process is currently divided into 5 “rings”.  The first (we call ring 0) is our own Team Services instance – the one the Team Services team uses to build Team Services.  The second is a small public instance with external customers on it and the rings grow to more and more public instances.

When we deploy a sprint release to a ring, we wait for 24 hours to monitor it and see if any issues arise and fix them before rolling to the next ring.  So, assuming we have no issues that extend the 24 hour “observation time”, it takes us at least 5 days to do the deployment.  Sometimes we have issues and it takes 6, 7 or 8 days.

A sprint ends every 3rd Friday.  The first production deployment (ring 0) generally happens by Wed or Thurs of the week following the sprint end.  Because we don’t like to deploy to ring 1 on a Friday and risk not being here for issues over the weekend, we usually wait until Monday of the second week to roll out ring 1.  So then, ring 2 – Tuesday, …, ring 4 Thursday and the deployment is finished and everyone has everything by Friday of the second week.  And then we go straight into finishing up the work for the following sprint on the 3rd week and start all over again – it’s never ending 🙂

So when do we notify customers that we’re making an update?  My philosophy has generally been that I don’t want people seeing new features roll out without being able to find release notes/docs describing them.  But I also have resisted rolling out release notes for changes that no one can see – it just creates anxiety about why I can’t have it now.

So, our policy has been to publish the release notes when the deployment to ring 1 (the first public ring) is complete.  Of course, as we’ve added more rings and the deployment has stretched out, an increasing number of customers do end up seeing release notes before the features go live in their accounts and it hasn’t created a huge problem.

Over the past few months, we’ve been getting a bunch of feedback, particularly from our larger customers with hundreds or thousands of Team Services users, that they would like to know what’s coming sooner.  They don’t like being surprised when stuff just shows up and they need a little time to investigate what the changes mean for them and whether or not they need to send additional communication to their teams.

To honor that request, we are experimenting with changing our publishing process.  We have started publishing the release notes as soon as they are ready – which generally means the middle of the 1st week after a sprint end, around the time ring 0 is deployed, but before *any* external customer can actually see the changes.

That is why our sprint 107 release notes were published yesterday afternoon and I am blogging about it today, despite the fact that none of you have access to any of it.  We hope this, combined with the more course grained roadmap that we publish will meet the needs of people looking for more forewarning of changes.  We also hope that people can wrap their head around the update announcements well before availability (on average, about a week before).

Some people have asked for even more forewarning and, for now, I don’t have any solution for that.  Our roadmap gives a longer term picture (6 months) of the big things we are working and our release notes, now, give a 1 week preview of imminent changes.  Given our backlog based development methodology, anything between those two granularities is hard to do and likely to have a lot of errors.

As always, feedback is welcome.

So, on to Sprint 107 updates…

Sprint 107 is delivering quite a few updates and some of them are pretty darned nice.  The biggest visual change is that we are flipping the new navigation structure on by default.  If users aren’t ready for the change yet, they can still turn it off but we’re going to remove that ability before too long and everyone will be on the new nav experience.

Probably the most helpful set of changes are the version control ones – lots of very nice UX improvements and new features.  The Cherry-pick and revert additions are very nice.  The new file/folder quick search is small but a really nice, snappy experience.

The Azure continuous delivery enhancements are just one step out of many in the journey we are on over the next few months to create a truly impressive and simple Azure CI/CD capability.  Stay tuned for more every sprint.

There’s lots of other nice improvement that I don’t mean to downplay.  Check out the release notes for full details.

Brian

C++/WinRT Available on GitHub

$
0
0

C++/WinRT is now available on GitHub. This is the future of the Modern C++ project and the first public preview coming officially from Microsoft.

https://github.com/microsoft/cppwinrt

C++/WinRT is a standard C++ language projection for the Windows Runtime implemented solely in header files. It allows you to both author and consume Windows Runtime APIs using any standards-compliant C++ compiler. C++/WinRT is designed to provide C++ developers with first-class access to the modern Windows API.

Please give us your feedback as we work on the next set of features.

Bentley’s Cloud Solution is Instrumental to Europe’s Largest Construction Project

$
0
0

London is a dynamic city with over two millennia of history which span several eras of buildings and infrastructure. So it’s an ambitious undertaking to build a new subway line right through the center of it. The London Crossrail railway project is the largest construction project in Europe with a £14.8 billion budget. The project consists of over 60 miles of above and below ground rail, 10 new stations and updates of 30 existing stations. The challenge for Crossrail was managing information amongst hundreds of contractors with the risk of information loss and miscommunication between project phases and teams, causing errors, safety risks, and increased project costs. Crossrail also wanted to increase effectiveness during construction, where engineers could visualize complexities surrounding the project so design changes can easily be integrated throughout the project.

 For the project Crossrail teamed up with Bentley Systems. Bentley’s charter was to facilitate collaboration by bringing all the data into one environment, so information is continuously available to all of the contractors where and when they need it – on time and on budget. Crossrail had already been utilizing Bentley’s modeling software to design in a virtual environment along with their project information and collaboration software and Bentley’s asset management software in a Common Data Environment (CDE), but as the data grew they decided to extend their solution to a hybrid model powered by Microsoft Azure. By using a hybrid model with Azure, Crossrail can work with their entire supply chain, using digital technologies to manage and join up the data that underpins the design, construction and operation activities of an asset across its lifecycle from conception to decommissioning. It provides a single location for storing, sharing, and managing information. This creates a “virtual railroad” where the existing infrastructure and future infrastructure could be viewed simultaneously.

 Alan Kiraly, Senior Vice President of Asset Performance at Bentley, explained: “People have used 3D models to design stuff for twenty years. But we are making a comprehensive virtual world that depicts the terrain, the tunnel and all of the associated data.” You can see more about this project in the video below.


Alan Kiraly says that Bentley “use[s] the entire Azure stack for extending our solution to the cloud.” When the project is finished, Bentley’s virtual model will be used to manage ongoing operations, enabling maintenance crews to assess repairs without shutting down the subway. By using Azure, Bentley is able to streamline the construction of the tunnel and have a resource for future teams to extend or maintain the tunnel.

 Digital transformation is often thought of in the context of changing how we communicate, share pictures or hail a cab. Yet, as we can see from the London Crossrail project it can be used to change how we build and update our physical surroundings. By using the cloud not only is it easier to share information but it leaves an asset for people in the future to use. In this case people who will do the repairs. As your companies transform or disrupt industries, think about new ways that things can be done better and then the technologies that can support it. Happy coding.


Cheers,

Guggs

@stevenguggs


Faster C++ solution load and build performance with Visual Studio “15”

$
0
0

With Visual Studio ‘15’ our goal is to considerably improve productivity for C++ developers. With this goal in mind we are introducing many new improvements, which you can try out in the recently released Preview 5 build. The highlights of this release include the following:

Faster C++ solution load

‘Fast project load’ is a new experimental feature for C++ projects. The first time you open a C++ project it will load faster, and the time after that it will load even faster! To try out this experimental feature set ‘Enable Faster Project Load’ to true in Tools -> Options as shown in the figure below:

The small demo below depicts these improvements on the large Chromium Visual Studio Solution which has 1968 projects. You can learn more about how faster C++ solution load operates by reading this detailed post we published earlier.

There is another experimental effort underway in Visual Studio to improve solution load called “lightweight solution load”.  This is a completely different approach and you can read about it here.
Generally, it will avoid loading projects at all and will only load a project when a user explicitly expands a project in Solution Explorer.  The C++ team has been focused on Fast Project Load and so our support for lightweight solution load is currently minimal.  In the RC release of Visual Studio 15, we expect to support fast project load feature in conjunction with Lightweight Solution Load.  This combination should provide a great experience.

Faster build cycle with /Debug:fastlink

Developer builds will now build faster, because of faster links with an integrated /debug:fastlink experience. Expect to see 2-4x linker improvements for your application builds.

The figure below illustrates how /debug:fastlink helps improve link times for some popular C++ sources. You can learn more about /debug:fastlink and its integration into Visual Studio by reading this blog post we published last week.


Reducing out-of-memory crashes in VS while debugging

With VS “15” Preview 5, we have also taken a step towards reducing memory consumed by symbol information, while maintaining the performance benefit of pre-fetching symbol data. We now enable pre-fetching only on modules that are relevant for evaluating and displaying a variable or expression. As a result, we are now able to successfully debug the Unreal engine process and contain it within 3GB of virtual memory and 1.8GB of private working set. Previously in VS 2015 when debugging the Unreal engine process, we would run out-of-memory. Clearly this is an improvement over the previous release, but we’re not done yet. We will be continuing to drive down memory usage in native debugging scenarios during the rest of VS “15” development.

Wrap Up

As always, we welcome your feedback and we would love to learn from your experiences as you try out these features. Do let us know how these improvements scale for your C++ code base.
If you run into any problems, let us know via the Report a Problem option, either from the installer or the Visual Studio IDE itself. You can also email us your query or feedback if you choose to interact with us directly! For new feature suggestions, let us know through User Voice.

Jim Springfield, Principal Architect, Visual C++ team.

Jim is passionate and guru about all things C++ and is actively involved in redesigning of the compiler frontend, language service engine, libraries and more. Jim is also the author of popular C++ libraries MFC, and ATL and his most recent work also involves development of the initial cross-platform C++ language service experience for upcoming editor Visual Studio Code.

Ankit Asthana, Senior Program Manager, Visual C++ team.

Ankit’s focus area is cross-platform mobile development along with native code generation tools. Ankit is also knowledgeable in compilers, distributed computing and server side development. He has in the past worked for IBM and Oracle Canada as a developer building Java 7 (hotspot) optimization and telecommunication products. Ankit back in 2008 also published a book on C++ titled ‘C++ for Beginners to Masters’ which sold over a few thousand copies.

Bing Maps V8 SDK September 2016 Update

$
0
0

In this regular update to the Bing Maps Version 8 developer control (V8), we have added a couple of new data visualization features to help you make better sense of your business data.

Data Binning Module

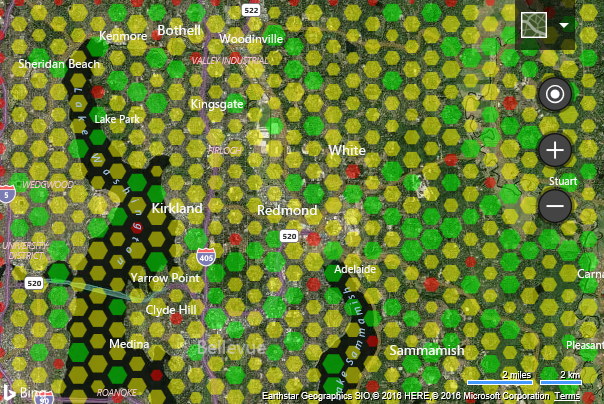
Data binning, is the process of grouping point data into a symmetric grid of geometric shapes. An aggregate value can then be calculated from the pins in a bin and used to set the color or scale of that bin to provide a visual representation of a data metric that the bin contains. The two most common shapes used in data binning are squares and hexagons. When hexagons are used, this process is also referred to as hex binning. Since the size and the color can both be customized based on an aggregate value, it is possible to have a single data bin represent two data metrics (bivariant). The data binning module makes it easy to create data bins from thousands of pushpins.

Try it now

Here are links to additional data binning code samples and documentation.

Contour Module

Contour Lines, also known as isolines, are lines that connect points that share a characteristic of equal value. These are often used for visualizing data such as elevations, temperatures, and earthquake intensities on a flat 2D map. This module makes it easy to take contour line data and visualize it on Bing Maps as non-overlapping colored areas.

Try it now

Here are links to additional contour module code samples and documentation.

TypeScript Definitions

The TypeScript definitions for Bing Maps V8 have been updated to include the September updates. In addition to being available through NuGet, we have also made these definitions available through npm.

Additional Improvements

In addition to these new features, this update also includes many smaller feature additions such as double click event support for shapes and several bug fixes.

A complete list of new features added in this release can be found on the What’s New page in the documentation on MSDN. We have many other features and functionalities on the road map for Bing Maps V8. If you have any questions or feedback about V8, please let us know on the Bing Maps forums or visit the Bing Maps website to learn more about our V8 web control features.

-        Bing Maps Team

Hosting .NET Core Services on Service Fabric

$
0
0

This post was written by Vaijanath Angadihiremath, a software engineer on the .NET team.

This tutorial is for users who already have a group of ASP.NET Core services which they want to host as microservices in Azure using Azure Service Fabric. Azure Service Fabric is a great way to host microservices in a PaaS world to obtain many benefits like high density, scalability and upgradability. In this tutorial, I will take a self-contained ASP.NET Core service targeting the .NETCoreApp framework and host it as a guest executable in Service Fabric.

Writing cross platform services/apps using the same code base is one of the key benefits of ASP.NET Core. If you plan to host the services on Linux and also want to host the same set of services using Service Fabric, then you can easily achieve this by using the guest services feature of Service Fabric. You can run any type of application, such as Node.js, Java, ASP.NET Core or native applications in Service Fabric. Service Fabric terminology refers to those types of applications as guest executables. Guest executables are treated by Service Fabric like stateless services. As a result, they will be placed on nodes in a cluster, based on availability and other metrics.

The current Service Fabric SDK templates only provide a way to host .NET services which target full .NET Frameworks, like the .NET Framework 4.5.2. If you already have a service that targets .NETCoreApp alone or .NETCoreApp and .NET Framework 4* then you cannot use the built-in ASP.NET Core template as the Service Fabric SDK only supports .NET Framework 4.5.2. To work around this, we need to use the guest services solution for all the projects that target .NETCoreApp as a target framework in their project.json.

Service Fabric Application package

As explained in Deploying a guest executable to Service Fabric, any Service Fabric application that is deployed on a Service Fabric cluster needs to follow a predefined directory structure.

|-- ApplicationPackage
    |-- code
        |-- existingapp.exe
    |-- config
        |-- Settings.xml
    |-- data
    |-- ServiceManifest.xml
|-- ApplicationManifest.xml

The root contains the ApplicationManifest.xml that defines the entire application. A subdirectory for each service included in the application is used to contain all the artifacts that the respective service requires. It contains the following items:

  • ServiceManifest.xml: this file defines the service.
  • Code: this directory contains the service code.
  • Config: this directory contains a Settings.xml for configuring specific settings for service.
  • Data: this directory stores local data that the service might need.

In order to deploy a guest service, we need to get all the required binaries to run the service and copy them under the Code folder. Config and Data folders are optional only and are used by services that require them. For .NETCoreApp self-contained projects, you can easily achieve this directory structure by using the publish to file system mechanism from Visual Studio. Once you publish the service to a folder, all the required binaries for the service including .NETCoreApp binaries will be copied to this folder. We can then use the published location and map it to Code folder in the Service Fabric service.

Publish .NETCoreApp Service to Folder

Right-click the .NET Core project and click Publish.

Create a custom publish target and name it appropriately to describe the final published service. I am deploying an account-management service and naming it Account.

Creating a new publish target

Under Connection, set the Target location where you want the project to be published. Choose the Publish method as File System.

Setting publish target location

Under Settings, set the Configuration to be Release – Any CPU, Target Framework to be .NETCoreApp, Version=v1.0 and Target Runtime to be win10-64. Click the Publish button.

Specifying publish settings

You have now published the service to a directory.

Creating a Guest Service Fabric Application

Visual Studio provides a Guest Service Fabric Application template to help you deploy a guest executable to a Service Fabric cluster.

Following are the steps.

  1. Choose File ->New Project and Create a Service Fabric Application. The template can be found under Visual C# ->Cloud. Choose an appropriate project name as this will reflect the name of the application that is deployed on the Cluster. Creating a guest service
  2. Choose the Guest Executable template. Under the Code Package Folder, browse to previously published directory of service.
  3. Under Code Package Behavior you can specify either Add link to external folder or Copy folder contents to Project. You can use the linked folders which will enable you to update the guest executable in its source as a part of the application package build.
  4. Choose the Program that needs to run as service and also specify the arguments and working directory if they are different. In my case I am just using Code Package.
  5. If your Service needs an endpoint for communication, you can now add the protocol, port and type to the ServiceManifest.xml for example

  6. Set the project as Startup Project.

  7. You can now publish to the cluster by just F5 debugging.

If you have multiple services that you want to deploy as Guest Services, you can simply edit this Guest Service Project file to include new Code, Config and Data packages for the new service or use the ServiceFabricAppPackageUtil.exe as mentioned in this Deploy multiple guest executables tutorial.

Resources

  1. Self-contained ASP.NET Core deployments
  2. Service Fabric programming model
  3. Deploying a guest service in Service Fabric.
  4. Deploying multiple guest services in Service Fabric.

Internet of Things on the Xbox (App Dev on Xbox series)

$
0
0

This week’s app is all about the Internet of Things. Best For You is a sample fitness UWP app focused on collecting data from a fictional IoT enabled yoga wear and presenting it to the user in a meaningful and helpful way on all of their devices to track health and progress of exercise. In this post, we will be focusing on the IoT side of the Universal Windows Platform as well as Azure IoT Hub and how they work together to create an end-to-end IoT solution. The source code for the application is available on GitHub right now so make sure to check it out.

image1

If you missed the previous blog post on Hosted Web Apps, make sure to check it out for in-depth on how to build hosted web experiences that take advantage of native platform functionality and different input modalities across UWP and other native platforms. To read the other blog posts and watch the recordings from the App Dev on Xbox live event that started it all, visit the App Dev on Xbox landing page.

Windows IoT Core

IoT, or the “Internet of Things,” is a system of physical objects capable of sensing the internal or external environment, connected to a larger network through which they are sending data to be processed and analyzed, and finally synthesized on the application level. This is intentionally a broad description, as IoT can take many shapes. It is the smart thermostat in your house, a water meter system on a massive hydroelectric dam, or a swarm of weather balloons with cellular data connections and GPS sensors.

The goal of most IoT scenarios is similar; gain a specific insight from, or operate on, its environment. For the purposes of this article, we’ll use an example of the smaller IoT systems that have the responsibility to collect a specific set of data using sensors and send that data to a more powerful system that can gain intelligence from that data to make larger decisions. Later in the post, we’ll reveal the fictional smart yoga ware and see how we can use Windows IoT to power the gear.

Windows IoT Core is a version of Windows 10 that is optimized for smaller devices with or without a display; devices such as Raspberry Pi 2 and 3, Arrow DragonBoard 410c, MinnowBoard MAX and upcoming support for the Intel Joule. There is also a professional version, Windows IoT Core Pro, that adds many enterprise friendly features, such as:

To install Windows IoT Core on a device is easier than it has ever been. You can use the Windows IoT Core Dashboard tool that automates the process of downloading the correct image for your device and flashing the OS onto the device’s memory for you.

Windows IoT leverages the flexible and powerful Universal Windows Platform. Yes, this means you can use your existing UWP skills, including XAML/C#, and deploy almost any UWP app onto an IoT device providing that you’re not leveraging special PC hardware (e.g. a AAA game that requires a powerful graphics card). Majority of UWP APIs work the same way, but you can also get access to IoT specific APIs on Windows IoT Core by simply adding a reference to the Windows IoT Extensions for the UWP. Getting started is really easy, and once the reference has been added you’ll get access to namespaces like Windows.Devices.Gpio and Windows.Devices.I2C (and many more) to begin developing for IoT specific scenarios.

Deploying a UWP app to an IoT Core device is the same as deploying to any remote Windows 10 device; no special knowledge set is required for this either! Simply select Remote Device as your target and put in the IP address (or machine name) and start debugging. Take a look at the Hello World sample app tutorial for Windows IoT to see just how easy it is.

Best For You

Let’s continue with an idea where we have invented smart yoga pants. A small IoT device is embedded in the Best For You yoga pants running Windows IoT Core with sensors woven into the fabric to capture environmental data such as heart rate, temperature (temp sensor) and leg position (flex sensor). These sensors are very small and virtually undetectable in the pants. The app running on the device constantly captures the incoming data from the sensors and sends it to the cloud for further processing.

Remember that the IoT device’s responsibility in this scenario is to monitor and report, not process the data. We’ll leave the processing up to more capable machines with much more processing power. There are many ways for the device to transfer this data, such as the very convenient and traditional HTTP (if the device can be connected to the internet directly), Bluetooth to a mobile device that can relay the data, and even through an AllJoyn (or other wireless standard) connection to a device like the IoTivity AllJoyn Device System Bridge.

With a way to communicate the data, where can we send that data so that it can be processed into meaningful insights? This is where Azure IoT Hub is ideal.

Azure IoT Hub

Azure IoT Hub is a powerful tool that allows for easy connection to all your Windows IoT devices in the field. It is a fully managed service that enables reliable and secure bi-directional communications between millions of Internet of Things (IoT) devices and a solution back end.

Here’s a high level architectural diagram of a Windows IoT Core solution with Azure IoT Hub and connected services to visualize and process the data:

image2

You can provision your Windows IoT devices so that they’re authenticated and can connect directly to the Hub. Provisioning your IoT device for Azure Hub is also easier than ever, the same IoT Dashboard you used to install Windows IoT lets you provision devices with Azure IoT Hub. You can read more about it in this blog post; here’s a screenshot of the IoT Core Dashboard’s provisioning tool:

image3

The Hub receives communications from the devices that contain data relevant to that’s devices’ responsibility. This usually takes the form of little data packets for each sensor reading. To continue with our smart yoga pants example, the IoT device’s UWP app takes a reading from all the sensors every second.

Capturing our sensor reading and sending it Azure IoT Hub might look something like this:

while (true)


{
    var pantsSensorDataPoint = new
    {
		rightLegAngle: rightLegSensor?.Value,
		leftLegAngle: leftLegSensor?.Value,
		bodyTemperature: tempSensor?.Value
        };

        var messageString = JsonConvert.SerializeObject(pantsSensorDataPoint );
        var message = new Message(Encoding.ASCII.GetBytes(messageString));

        await myAzureDeviceClient.SendEventAsync(message);

        Task.Delay(1000).Wait();
}

As we can see, the three sensors report a particular value, that we want to send to the Azure IoT Hub for processing.  Notice the myAzureDeviceClient; this is a DeviceClient class that comes from the Azure IoT Hub SDK (adding the SDK to your app is as simple as adding the Microsoft.Azure.Devices nuget package).

There is a little configuration to instantiate the client with your IoT Hub’s details, but when that’s ready all you needs to do to send up some data is call SendEventAsync(). To learn more about setting up the hub, check out this Getting Started with Azure IoT Hub tutorial, it covers everything you need to get up and running quickly. It simulates the IoT device with a small Console app, but you can replace that with your Windows IoT Core device’s UWP app as the nuget package can be added to UWP app as well. There is also a great Visual Studio Extension available to help you get configured quickly.

Alternatively, you can use an ARM template (ARM = Azure Resource Manager). An ARM template allows you to do an amazing “one-click deploy to Azure”. The template has a json file that defines the resources and the connection between those resources. An example of this is the ARM template linked in the readme of the project in GitHub.

Okay, so now we have the IoT Core device sending data to the Azure IoT Hub every second. How can we make use of this? How do we get insightful information from so much data? Let’s take a look at how we present the data.

Presenting the data

Once the data is being stored by the Azure IoT Hub, it can be used by other applications or used directly for analytics. We’ll cover two scenarios for the yoga pants data: Streaming analytics and a client UWP app running on an Xbox One!

Stream Analytics

You have the ability to hook up an Azure Streaming Analytics job to your Azure IoT Hub. The database that your Hub stores that data to becomes a treasure trove of information that can be plugged into a service like Power BI to be molded into insightful charts and graphs that present the information in a meaningful way.

First you need to setup your Stream analytics job, once that’s prepared, you create a query against the database using Stream Analytics Query Language (SAQL), this is very similar to SQL queries. An example to query against the yoga pants data to might look like this because it only has three relevant fields; LeftLegAngle, RightLegAngle and BodyTemp.

SELECT * FROM YogaPantsSensorTable

The output from the Stream Analytics would have each reading from every user. This is also known as a “passthrough query” because it sends all the data through to whatever consumes it. You can also take a look at other examples of how to use the query in this tutorial:  Get started using Azure Stream Analytics: Real-time fraud detection.

We could now connect the Stream Analytic Job to a service like Power BI in order to show the data in a multitude of charts to get at-a-glance information from all your sensors and users. Stream Analytics can support millions of events a second. This means you could have smart yoga pants for everyone, across the world, in a special world-wide yoga session and get immediate telemetry streaming into your data visualization apps. For more information on how to use Power BI and Stream analytics check out this tutorial: Stream Analytics & Power BI: A real-time analytics dashboard for streaming data.

Presenting Data in a UWP App

Now for the UI magic that bring all this together for the consumer’s delightful user experience. We’ll want a UWP app that runs on Xbox One (keep in mind that because this a UWP app, we can also run it on PC, Mobile and Hololens!).  Let’s start focusing on the Best For You demo app and how it delivers the experience to the user.

First we need to step back and think about some design considerations. When designing an IoT app for any device, it is crucial to think about the context in which the end user will be experiencing the app. A classic example of this train of thought would be if you were designing a remote control app for an IoT robot. Since the user may need to walk around during this interaction, the targeted device would be a phone or tablet.

However, when designing Best For You, we decided that the Xbox One is perfect for an exercise-focused app. Here are just a few reason why:

  • Xbox is great for hands free interactions. Since the devices are frequently in spacious room with about a 10ft viewing distance, this also gives the user a lot of space for said interactions.
  • Xbox is great for shared experiences. Spacious rooms can hold a lot of people that can simultaneously see and hear whatever is being played on the television.
  • Xbox is great for consumption.

Now that we know what the target device will be and how to design for it, we can start thinking about the flow of data from IoT Hub to the UI. The smart yoga pants have embedded heart rate sensors and has been sending this data to the Hub and we want to show this in the UI.

Let’s take a look at how the Best For You app connects to the Azure IoT Hub and gets the user’s heart rate. The demo app has a StatsPage.xaml, within that page is a StackPanel for displaying the user’s heart rate:

This TextBlock’s Text value is bound to a HeartRate property in the code-behind:


public string HeartRate
{
    get { return _heartRate; }
    set
    {
        _heartRate = value;
        …
        RaisePropertyChanged();   
    }
}

Now that the Property and the UI are configured, we can start getting some data from the Azure IoT Hub and update the HeartRate value.

We do this within a Task named CheckHeartRate, let’s break the task down. First, we need to connect to the IoT Hub:


var factory = MessagingFactory.CreateFromConnectionString(ConnectionString);

var client = factory.CreateEventHubClient(EventHubEntity);
var group = client.GetDefaultConsumerGroup();

var startingDateTimeUtc = DateTime.Now;

var receiver = group.CreateReceiver(PartitionId, startingDateTimeUtc);

The EventHubReceiver is where we can start receiving messages from the IoT Hub! Let’s look at how to get data from the EventHubReceiver:


while (true)
{
    EventData data = receiver.Receive();
    if (data == null) continue;

    await Dispatcher.RunAsync(Windows.UI.Core.CoreDispatcherPriority.Normal, () =>
    {
        HeartRate = Encoding.UTF8.GetString(data.GetBytes());
    });
}

That’s it! Calling the Receive method on the EventHubReceiver and will get you an EventData object. From there you call GetBytes and since out HeartRate property is a string, we convert it to a string and then update the HeartRate property. The data has now made the successful trip from pants sensor, to Windows IoT, to Azure IoT Hub and finally to UWP app on Xbox One!

Here’s what the UWP’s app UI looks like on Xbox One (see the heart logo and the heart rate at the top right):

image4

This isn’t necessarily the end of the journey of the data from sensor to UWP app. You can add a sharing mechanism into the UWP app and have the user share their progress and scores on social media and engage other users of your amazing smart yoga pants solution. Alternatively, you could also gamify the app and have a leaderboard in Azure and use Stream Analytics pull in the currently trending users.

That’s all!

Now that you are here, make sure to check out the app source for the UWP app on our official GitHub repository. Read through some of the resources provided below in the Resources section, watch the event if you missed it and let us know what you think through the comments below or on twitter.

Don’t forget to check back in next week for yet another blog post and a new app sample where we will focus on how to take advantage of the camera APIs in UWP and how to add intelligence by using the vision, face and emotion APIs from cognitive services.

Until then, happy coding!

Resources

Previous Xbox Series Posts

Improved overall Visual Studio “15” Responsiveness

$
0
0

This is the final post in a five-part series covering performance improvements for Visual Studio “15”.

This series covers the following topics:

In this post we will highlight some of the improvements we’ve made in the Preview 5 release that make using Visual Studio more responsive as part of your daily use. We’ll first talk about improvements to debugging performance, Git source control, editing XAML, and finally how you can improve your typing experience by managing your extensions.

Debugging is faster and doesn’t cause delays while editing

In Visual Studio 2005 we introduced what’s known as the hosting process for WPF, Windows Forms, and Managed Console projects to make “start debugging” faster by spinning up a process in the background that can be used for the next debug session. This well-intentioned feature was causing Visual Studio to temporarily become unresponsive for seconds when pressing “stop debugging” or otherwise using Visual Studio after the debug session ended.

In Preview 5 we have turned off the hosting process and optimized “start debugging” so that it is just as fast without the hosting process, and even faster for projects that never used the hosting process such as ASP.NET, Universal Windows, and C++ projects. For example, here are some startup times we’ve measured on our test machines for our sample UWP Photo Sharing app, a C++ app that does Prime Visualization, and a simpler WPF app:

To achieve these improvements, we’ve optimized costs related to initializing the Diagnostic Tools window and IntelliTrace (which appears by default at the start of every debugging session) from the start debugging path. We changed the initialization from IntelliTrace so that it can be initialized in parallel with the rest of the debugger and application startup. Additionally we eliminated several inefficiencies with the way the IntelliTrace logger and Visual Studio processes communicate when stopping at a breakpoint.

We also eliminated several places where background threads related to the Diagnostic Tools window had to synchronously run code on the main Visual Studio UI thread. This made our ETW event collection more asynchronous so that we don’t have to wait for old ETW sessions to finish when restarting debugging.

Source code operations are faster with Git.exe

When we introduced Git support in Visual Studio we used a library called libgit2. With libgit2, we have had issues with functionality being different between libgit2 and the git.exe you use from the command prompt and that libgit2 can add 100s of megabytes of memory pressure to the main Visual Studio process.

In Preview 5, we have swapped this implementation out and are calling git.exe out of process instead, so while git is still using memory on the machine it is not adding memory pressure to the main VS process. We expect that using git.exe will also allow us to make git operations faster over time. So far we have found git clone operations to faster with large repos: cloning the Roslyn .NET Compiler repo on our machines is 30% faster: takes 4 minutes in Visual Studio ‘15’ compared with 5 minutes, 40 seconds with Visual Studio ‘15’. The following video shows this (for convenience the playback is at 4x speed):

In the coming release we hope to make more operations faster with this new architecture.

We have also improved a top complaint when using git: switching branches from the command line can in cause Visual Studio to reload all projects in the solution one at a time. In the file change notification dialog we’ve replaced ‘Reload All’ with ‘Reload Solution’:

This will kick off a single async solution reload which is much faster than the individual project reloads.

Improved XAML Tab switch speed

Based on data and customer feedback, we believe that 25% developers experience at least one tab switch delay > 1 sec in a day when switching between XAML tabs. On further investigation, we found that these delays were caused by running the markup compiler, and we’ve made use of the XAML language service to make this substantially faster. Here’s a video showing the improvements we’ve made:

The markup compiler is what creates the g.i.* file for each XAML file which, among other things, contains fields that represent the named elements in the XAML file that enables you to reference those named elements from code-behind. For example, given , the g.i.* file will contain a field named button of type Button that allows you to use “myButton” in code.

Certain user actions such as saving or switching away from an unsaved XAML file will cause Visual Studio to update the g.i.* file to ensure that IntelliSense has an up-to-date view of your named elements when you open your code-behind file. In past releases, this g.i.* update was always done by the markup compiler. In managed (C#/VB) projects the markup compiler is run on the UI thread resulting in a noticeable delay switching between tabs on complex projects.

We have fixed this issue in Preview 5 by leveraging the XAML Language Service’s knowledge of the XAML file to determine the names and types of the fields to populate IntelliSense, and then update the g.i.* file using Roslyn on a background thread. This is substantially faster than running the markup compiler because the language service has already done all the parsing and type metadata loading that causes the compiler to be slow. If the g.i.* file does not exist (e.g. after renaming a XAML file, or after you delete your project’s obj directory), we will need to run the markup compiler to generate the g.i.* file from scratch and you may still see a delay.

Snappier XAML typing experience

The main cause of UI delays in our XAML Language Service were related to initialization, responding to metadata changes, and loading design assemblies. We have addressed all three of these delays by moving the work to a background thread.

We’ve also made the following improvements to the design of assembly metadata loading include:

  • A new serialization layer for design assembly metadata that significantly reduces cross boundary calls.
  • Reuse of the designer’s assembly shadow cache for WPF projects. Reuse of the shadow cache across sessions for all project types. The shadow cache used to be recreated on every metadata change.
  • Design assembly metadata is now cached for the duration of the session instead of being recomputed on every metadata change.

These changes also allow XAML IntelliSense to be available before the solution is fully loaded.

Find out which extensions cause typing delays

We have received a number of reports about delays while typing. We are continuing to make bug fixes to improve these issues, but in many cases delays while typing are caused by extensions running code during key strokes. To help you determine if there are extensions impacting your typing experience, we have added reporting to Help -> Manage Visual Studio performance, and will notify you when we detect extensions slowing down typing.

Notification of extensions slowing down typing

You can see more details about extensions in Help -> Manage Visual Studio Performance

Try it out and report issues

We are continuing to work on improving the responsiveness of Visual Studio, and this post contains some examples of what we have accomplished in Preview 5. We need your help to focus our efforts on the areas that matter most to you, so please download Visual Studio ‘15’ Preview 5, and use the Report-a-Problem tool to report areas where we can make Visual Studio better for you.

Dan Taylor, Senior Program Manager

Dan Taylor has been at Microsoft for 5 years working on performance improvements to .NET and Visual Studio, as well as profiling and diagnostic tools in Visual Studio and Azure

LightSwitch Update

$
0
0

Our vision for LightSwitch was to accelerate the development of line-of-business apps, but the landscape has changed significantly from the time when we first thought about LightSwitch (think mobile and cloud for example). There are now more connected and relevant choices from Microsoft and our partners for business app development.

Visual Studio 2015 is the last release of Visual Studio that includes the LightSwitch tooling and we recommend users not begin new application development with LightSwitch. That said, we will continue to support users with existing LightSwitch applications, including critical bug fixes and security issues as per the Microsoft Support Lifecycle.  For reference, the mainstream support phase for Visual Studio 2015 is active until 10/13/2020.  Read more about mainstream support.

We no longer recommend LightSwitch for your new apps. But we remain committed to fulfilling our vision to significantly raise the productivity bar for building modern LOB applications, which is why Microsoft is aligning efforts behind PowerApps.  Microsoft PowerApps is a solution to build custom business applications that enables increased productivity with business apps that are easily created, shared and managed. PowerApps offers a modern, intuitive experience for LOB application development.   Learn more about PowerApps.

– The Visual Studio Team

UML Designers have been removed; Layer Designer now supports live architectural analysis

$
0
0

We are removing the UML designers from Visual Studio “15” Enterprise. Removing a feature is always a hard decision, but we want to ensure that our resources are invested in features that deliver the most customer value.  Our reasons are twofold:

  1. On examining telemetry data, we found that the designers were being used by very few customers, and this was confirmed when we consulted with our sales and technical support teams.
  2. We were also faced with investing significant engineering resource to react to changes happening in the Visual Studio core for this release.

If you are a significant user of the UML designers, you can continue to use Visual Studio 2015 or earlier versions, whilst you decide on an alternative tool for your UML needs.
 
However, we continue to support visualizing of the architecture of .NET and C++ code through code maps, and for this release have made some significant improvements to Layer (dependency) validation. On interviewing customers about Technical Debt, architectural debt, in particular unwanted dependencies, surfaces as being a significant pain point. Since 2010, Visual Studio Ultimate, now Enterprise, has included the Layer Designer, which allows desired dependencies in .NET code to be specified and validated. However, validation only happens at build time and errors only surface at the method level, not at the lines of code which are actually violating the declared dependencies. In this release, we have rewritten layer validation to use the .NET Compiler Platform (“Roslyn”), which allows architecture validation to happen in real-time, as you type, as well as on build, and also means that reported errors are treated in the user experience like any other code analysis error. This means that developers are less likely to write code that introduces unwanted dependencies, as they will be alerted in the editor as they type. Moving to Roslyn, also makes it possible to create a plugin for SonarQube allowing layer validation errors to be reported with other technical debt during continuous integration and code review via pull requests, using the SonarQube build tasks integrated with Visual Studio Team Services. The plugin is on our near term backlog.
 

If you haven’t tried the Layer Designer before, we encourage you to give it a try. More detail on how to use it is available Live architecture dependency validation in Visual Studio ’15’ Preview 5. And please provide feedback not only on the experience, but also other rules you would like to see implemented.


Exploring ASP.NET Core with Docker in both Linux and Windows Containers

$
0
0

In May of last year doing things with ASP.NET and Docker was in its infancy. But cool stuff was afoot. I wrote a blog post showing how to publish an ASP.NET 5 (5 at the time, now Core 1.0) app to Docker. Later in December of 2015 new tools like Docker Toolbox and Kitematic made things even easier. In May of 2016 Docker for Windows Beta continued to move the ball forward nicely.

I wanted to see how things are looking with ASP.NET Core, Docker, and Windows here in October of 2016.

I installed these things:

Docker for Windows is really nice as it automates setting up Hyper-V for you and creates the Docker host OS and gets it all running. This is a big time saver.

Hyper-V manager

There's my Linux host that I don't really have to think about. I'll do everything from the command line or from Visual Studio.

I'll say File | New Project and make a new ASP.NET Core application running on .NET Core.

Then I right click and Add | Docker Support. This menu comes from the Visual Studio Tools for Docker extension. This adds a basic Dockerfile and some docker-compose files. Out of the box, I'm all setup to deploy my ASP.NET Core app to a Docker Linux container.

ASP.NET Core in a Docker Linux Container

Starting from my ASP.NET Core app, I'll make sure my base image (that's the FROM in the Dockerfile) is the base ASP.NET Core image for Linux.

FROM microsoft/aspnetcore:1.0.1
ENTRYPOINT ["dotnet", "WebApplication4.dll"]
ARG source=.
WORKDIR /app
EXPOSE 80
COPY $source .

Next, since I don't want Docker to do the building of my application yet, I'll publish it locally. Be sure to reach Steve Lasker's blog post "Building Optimized Docker Images with ASP.NET Core" to learn how to have one docker container build your app and the other run it it. This optimizes server density and resource.

I'll publish, then build the images, and run it.

>dotnet publish

>docker build bin\Debug\netcoreapp1.0\publish -t aspnetcoreonlinux

>docker images
REPOSITORY TAG IMAGE ID CREATED SIZE
aspnetcoreonlinux latest dab2bff7e4a6 28 seconds ago 276.2 MB
microsoft/aspnetcore 1.0.1 2e781d03cb22 44 hours ago 266.7 MB

>docker run -it -d -p 85:80 aspnetcoreonlinux
1cfcc8e8e7d4e6257995f8b64505ce25ae80e05fe1962d4312b2e2fe33420413

>docker ps
CONTAINER ID IMAGE COMMAND CREATED STATUS PORTS NAMES
1cfcc8e8e7d4 aspnetcoreonlinux "dotnet WebApplicatio" 2 seconds ago Up 1 seconds 0.0.0.0:85->80/tcp clever_archimedes

And there's my ASP.NET Core app running in Docker. So I'm running Windows, running Hyper-V, running a Linux host that is hosting Docker containers.

What else can I do?

ASP.NET Core in a Docker Windows Container running Windows Nano Server

There's Windows Server, there's Windows Server Core that removes the UI among other things and there's Windows Nano Server which gets Windows down to like hundreds of megs instead of many gigs. This means there's a lot of great choices depending on what you need for functionality and server density. Ship as little as possible.

Let me see if I can get ASP.NET Core running on Kestral under Windows Nano Server. Certainly, since Nano is very capable, I could run IIS within the container and there's docs on that.

Michael Friis from Docker has a great blog post on building and running your first Docker Windows Server Container. With the new Docker for Windows you can just right click on it and switch between Linux and Windows Containers.

Docker switches between Mac and Windows easily

So now I'm using Docker with Windows Containers. You may not know that you likely already have Windows Containers! It was shipped inside Windows 10 Anniversary Edition. You can check for Containers in Features:

Add Containers in Windows 10

I'll change my Dockerfile to use the Windows Nano Server image. I can also control the ports that ASP.NET talks on if I like with an Environment Variable and Expose that within Docker.

FROM microsoft/dotnet:nanoserver
ENTRYPOINT ["dotnet", "WebApplication4.dll"]
ARG source=.
WORKDIR /app
ENV ASPNETCORE_URLS http://+:82
EXPOSE 82
COPY $source .

Then I'll publish and build...

>dotnet publish
>docker build bin\Debug\netcoreapp1.0\publish -t aspnetcoreonnano

Then I'll run it, mapping the ports from Windows outside to the Windows container inside!

NOTE: There's a bug as of this writing that affects how Windows 10 talks to Containers via "NAT" (Network Address Translation) such that you can't easily go http://localhost:82 like you (and I) want to. Today you have to hit the IP of the container directly. I'll report back once I hear more about this bug and how it gets fixed. It'll show up in Windows Update one day. The workaround is to get the IP address of the container from docker like this:  docker inspect -f "{{ .NetworkSettings.Networks.nat.IPAddress }}" HASH

So I'll run my ASP.NET Core app on Windows Nano Server (again, to be clear, this is running on Windows 10 and Nano Server is inside a Container!)

>docker run -it -d -p 88:82 aspnetcoreonnano
afafdbead8b04205841a81d974545f033dcc9ba7f761ff7e6cc0ec8f3ecce215

>docker inspect -f "{{ .NetworkSettings.Networks.nat.IPAddress }}" afa
172.16.240.197

Now I can hit that site with 172.16.240.197:82. Once that bug above is fixed, it'll get hit and routed like any container.

The best part about Windows Containers is that they are fast and light weight. Once the image is downloaded and build on your machine, you're starting and stopping them in seconds with Docker.

BUT, you can also isolate Windows Containers using Docker like this:

docker run --isolation=hyperv -it -d -p 86:82 aspnetcoreonnano

So now this instance is running fully isolated within Hyper-V itself. You get the best of all worlds. Speed and convenient deployment plus optional and easy isolation.

ASP.NET Core in a Docker Windows Container running Windows Server Core 2016

I can then change the Dockerfile to use the full Windows Server Core image. This is 8 gigs so be ready as it'll take a bit to download and extract but it is really Windows. You can also choose to run this as a container or as an isolated Hyper-V container.

Here I just change the FROM to get a Windows Sever Core with .NET Core included.

FROM microsoft/dotnet:1.0.0-preview2-windowsservercore-sdk
ENTRYPOINT ["dotnet", "WebApplication4.dll"]
ARG source=.
WORKDIR /app
ENV ASPNETCORE_URLS http://+:82
EXPOSE 82
COPY $source .

NOTE: I hear it's likely that the the .NET Core on Windows Server Core images will likely go away. It makes more sense for .NET Core to run on Windows Nano Server or other lightweight images. You'll use Server Core for heavier stuff. If you REALLY want to have .NET Core on Server Core you can make your own Dockerfile and easily build and image that has the things you want.

Then I'll publish, build, and run again.

>docker images
REPOSITORY TAG IMAGE ID CREATED SIZE
aspnetcoreonnano latest 7e02d6800acf 24 minutes ago 1.113 GB
aspnetcoreonservercore latest a11d9a9ba0c2 28 minutes ago 7.751 GB

Since containers are so fast to start and stop I can have a complete web farm running with Redis in a Container, SQL in another, and my web stack in a third. Or mix and match.

>docker ps
CONTAINER ID IMAGE COMMAND PORTS NAMES
d32a981ceabb aspnetcoreonwindows "dotnet WebApplicatio" 0.0.0.0:87->82/tcp compassionate_blackwell
a179a48ca9f6 aspnetcoreonnano "dotnet WebApplicatio" 0.0.0.0:86->82/tcp determined_stallman
170a8afa1b8b aspnetcoreonnano "dotnet WebApplicatio" 0.0.0.0:89->82/tcp agitated_northcutt
afafdbead8b0 aspnetcoreonnano "dotnet WebApplicatio" 0.0.0.0:88->82/tcp naughty_ramanujan
2cf45ea2f008 a7fa77b6f1d4 "dotnet WebApplicatio" 0.0.0.0:97->82/tcp sleepy_hodgkin

Conclusion

Again, go check out Michael's article where he uses Docker Compose to bring up the ASP.NET Music Store sample with SQL Express in one Windows Container and ASP.NET Core in another as well as Steve Lasker's blog (in fact his whole blog is gold) on making optimized Docker images with ASP.NET Core.

IMAGE ID            RESPOSITORY                   TAG                 SIZE
0ec4274c5571 web optimized 276.2 MB
f9f196304c95 web single 583.8 MB
f450043e0a44 microsoft/aspnetcore 1.0.1 266.7 MB
706045865622 microsoft/aspnetcore-build 1.0.1 896.6 MB

Steve points out a number of techniques that will allow you to get the most out of Docker and ASP.NET Core.

The result of all this means (IMHO) that you can use ASP.NET Core:

  • ASP.NET Core on Linux
    • within Docker containers
    • in any Cloud
  • ASP.NET Core on Windows, Windows Server, Server Core, and Nano Server.
    • within Docker windows containers
    • within Docker isolated Hyper-V containers

This means you can choose the level of feature support and size to optimize for server density and convenience. Once all the tooling (the Docker folks with Docker for Windows and the VS folks with Visual Studio Docker Tools) is baked, we'll have nice debugging and workflows from dev to production.

What have you been doing with Docker, Containers, and ASP.NET Core? Sound off in the comments.


Sponsor: Thanks to Redgate this week! Discover the world’s most trusted SQL Server comparison tool. Enjoy a free trial of SQL Compare, the industry standard for comparing and deploying SQL Server schemas.


© 2016 Scott Hanselman. All rights reserved.
     

Web-to-App Linking with AppUriHandlers

$
0
0

Overview

Web-to-app linking allows you to drive user engagement by associating your app with a website. When users open a link to your website, instead of opening the browser, your app is launched. If your app is not installed, your website is opened in the browser as usual. By implementing this feature, you can achieve greater app engagement from your users while also offering them a richer experience. For example, this could help address situations where your users may not get the best experience through the browser (e.g. on mobile devices or on desktop PCs where the app is more full-featured that the website).

To enable web-to-app linking you will need:

  • A JSON file that declares the association between your app (Package Family Name) and your website
    • This JSON file needs to be placed in the root of the host (website) or in the “.well-known” subfolder
  • To register for AppUriHandlers in your app’s manifest
  • To modify the protocol activation in your app’s logic to handle web URIs as well

To show how this feature can be integrated with your apps and websites, we will use the following scenario:

You are a developer that is passionate about Narwhals. You have a website—narwhalfacts.azurewebsites.net—as well as an app—NarwhalFacts —and you would like to create a tight association between them. In doing so, users can click a link to your content and be launched in the app instead of the browser. This gives the user the added benefits of the native app, like being able to view the content, even while offline. Furthermore, you have made significant investments in the app and created a beautiful and enjoyable experience that you want all of your users to enjoy.

Step 1: Open and run the NarwhalFacts App in Visual Studio

First download the source code for Narwhal Facts from the following location:

https://github.com/project-rome/AppUriHandlers/tree/master/NarwhalFacts

Next, launch Visual Studio 2015 from the Start menu. Then, go to Open → Project/Solution…:

image1

Go to the folder that contains NarwhalFacts’ source code and open the NarwhalFacts.sln Visual Studio solution file.

When the solution opens, run the app on the local machine:

image2

You will see the home page and a menu icon on the left. Select the icon to see the many pages of narwhal content the app offers.

image3

image4

Step 2: View the mirrored content on the web

Copy the following link:

http://narwhalfacts.azurewebsites.net/

Paste it into your browser’s address bar and navigate to it. Notice how the content on the web is almost identical to the content offered in the app.

image5

Step 3: Register to handle http and https links in the app manifest

In order to utilize web-to-app links, your app needs to identify the URIs for the websites it would like to handle. This is accomplished by adding an extension registration for Windows.appUriHandler in your app’s manifest file, Package.appxmanifest.

In the Solution Explorer in Visual Studio, right-click Package.appxmanifest and select View Code.

image6       image7

Notice the code in between the Application tags in the app manifest:


    ...

The above code tells the system that you would like to register to handle links from the specified host. If your website has multiple addresses like m.example.com, www.example.com, and example.com then you will need a separate host listed for each.

You might notice that this is similar to a custom protocol registration with windows.protocol. Registering for app linking is very similar to custom protocol schemes with the added bonus that the links will fall back gracefully to the browser if your app isn’t installed.

Step 4: Verify that your app is associated with your website with a JSON file on the host web server

To ensure only your app can open content to your website, you must also include your Package Family Name in a JSON file located in the web server root or at the well-known directory on the domain. This signifies your website giving consent for the listed apps to open your content. You can find the Package Family Name in the Packages section of the app manifest designer.

Go to the JSON directory in the NarwhalFacts source code and open the JSON file named windows-app-web-link.

Important

The JSON file should not have a .json file suffix.

Once the file is open, observe the contents in the file:


[{
  "packageFamilyName": "NarwhalFacts_9jmtgj1pbbz6e",
  "paths": [ "*" ],
  "excludePaths" : [ "/habitat*, /lifespan*" ]
 }]

Wildcards

The example above demonstrates the use of wildcards. Wildcards allow you to support a wide variety of links with just a few lines of code, similar to regular expressions. Web to app linking supports two wildcards in the JSON file:

WildcardDescription
*****Represents any substring
?Represents a single character


For instance, the example above will support all paths that start with narwhalfacts.azurewebsites.net except those that include “/habitat” and “/lifespan”. So narwhalfacts.azurewebsites.net/diet.htmlwill be supported, but narwhalfacts.azurewebsites.net/habitat.html, will not.

Excluded paths

To provide the best experience for your users, make sure that online only content is excluded from the supported paths in this JSON file. For example, “/habitat” and “/lifespan” are excluded in the example above. Wildcards are supported in the excluded paths as well. Also, excluded paths take precedence over paths.

Multiple apps


[{
  "packageFamilyName": "NarwhalFacts_9jmtgj1pbbz6e",
  "paths": [ "*" ],
  "excludePaths" : [ "/habitat*, /lifespan*" ]
 },
 {
  "packageFamilyName": "NarwhalAppTwo_32js90j1p9jmtg",
  "paths": [ "/example*, /links*" ]
 }]

If you have two apps that you would like to link to your website, just list both of the application Package Family Names in your windows-app-web-link file. Both apps can be supported with the user making the choice of which is the default link if both are installed. Made the wrong choice at first? Users can change their mind in Settings > Apps for Websites later.

Step 5: Handle links on Activation to deep link to content

Go to App.xaml.cs and notice the code in the OnActivated method:


protected override void OnActivated(IActivatedEventArgs e)
{
    Frame rootFrame = Window.Current.Content as Frame;

    if (rootFrame == null)
    {
        // Create a Frame to act as the navigation context and navigate to the first page
        rootFrame = new Frame();
        rootFrame.NavigationFailed += OnNavigationFailed;

        Window.Current.Content = rootFrame;
    }

    Type deepLinkPageType = typeof(MainPage);
    if (e.Kind == ActivationKind.Protocol)
    {
        var protocolArgs = (ProtocolActivatedEventArgs)e;       
        switch (protocolArgs.Uri.AbsolutePath)
        {
            case "/":
                break;
            case "/index.html":
                break;
            case "/classification.html":
                deepLinkPageType = typeof(ClassificationPage);
                break;
            case "/diet.html":
                deepLinkPageType = typeof(DietPage);
                break;
            case "/anatomy.html":
                deepLinkPageType = typeof(AnatomyPage);
                break;
            case "/population.html":
                deepLinkPageType = typeof(PopulationPage);
                break;
        }
    }

    if (rootFrame.Content == null)
    {
        // Default navigation
        rootFrame.Navigate(deepLinkPageType, e);
    }

    // Ensure the current window is active
    Window.Current.Activate();
}

Don’t Forget!:           

Make sure to replace the final if statement logic in the existing code with:

rootFrame.Navigate(deepLinkPageType, e);

This is the final step in enabling deep linking to your app from http and https links, let’s see it in action!

Step 6: Test it out!

Press Play to run your application to verify that it launches successfully.

image8

Observe that the application is running, if you run into issues, double check the code in steps 3 and 5.

Because our path logic is in OnActivated, close the NarwhalFacts application so that we can see if the app is activated when you click a link!

Copy the following link

http://narwhalfacts.azurewebsites.net/classification.html

Remember to make sure the NarwhalFacts app is closed and press Windows Key  + R to open the Run application and paste (Control + V) the link in the window. You should see your app launch instead of the web browser!

image9

If you would like to see how the protocol activation logic works. Set a breakpoint by clicking on the grey bar to the left of the switch statement in your OnActivated event.

image10

By clicking links you should see that the app launches instead of the browser! This will drive users to your app experience instead of the web experience when one is available.

Additionally, you can test your app by launching it from another app using the LaunchUriAsync API. You can use this API to test on phones as well. The Association Launching sample is another great resource to learn more about LaunchUriAsync.

Note: In the current version of this feature, any links in the browser (Edge), will keep you in the browsing experience.

Local validation tool

You can test the configuration of your app and website by running the App host registration verifier tool which is available in:

%windir%\system32\AppHostRegistrationVerifier.exe

Test the configuration of your app and website by running this tool with the following parameters:

AppHostRegistrationVerifier.exehostname packagefamilyname filepath

  • Hostname: Your website (e.g. microsoft.com)
  • Package Family Name (PFN): Your app’s PFN
  • File path: The JSON file for local validation (e.g. C:\SomeFolder\windows-app-web-link)

Note: If the tool does not return anything, validation will work on that file when uploaded. If there is an error code, it will not work.

Registry key for path validation

Additionally, by enabling the following registry key you can force path matching for side-loaded apps (as part of local validation):

HKCU\Classes\Local Settings\Software\Microsoft\Windows\CurrentVersion\AppModel\SystemAppData\Your_App\AppUriHandlers

  • Keyname: ForceValidation
  • Value: 1

AppUriHandlers tips:

  • Make sure to only specify links that your app can handle.
  • List all of the hosts that you will support. Note that www.example.com and example.com are different hosts.
  • Users can choose which app they prefer to handle websites in Settings -> Apps for Websites.
  • Your JSON file must be uploaded to an https server.
  • If you need to change the paths that you wish to support, you can republish your JSON file without republishing your app. Users will see the changes in 1-8 days.
  • All sideloaded apps with AppUriHandlers will have validated links for the host on install. You do not need to have a JSON file uploaded to test the feature.
  • This feature works whenever your app is a UWP app launched with LaunchUriAsync or a classic Windows application launched with ShellExecuteEx. If the URI corresponds to a registered App URI handler, the app will be launched instead of the browser.

See also

Download Visual Studio to get started.

The Windows team would love to hear your feedback.  Please keep the feedback coming using our Windows Developer UserVoice site. If you have a direct bug, please use the Windows Feedback tool built directly into Windows 10.

In Case You Missed It – This Week in Windows Developer

$
0
0

Before we get into all of last week’s updates, check out this highlight. (It’s a big deal):

Cross device experiences and Project Rome

We read the morning news on our tablets, check email during the morning commute on our phones and use our desktop PCs when at work. At night, we watch movies on our home media consoles. The Windows platform targets devices ranging from desktop PCs, laptops and smartphones, to large-screen hubs, HoloLens, wearable devices, IoT and Xbox.

With all of these devices playing important roles in the daily lives of users, it’s easy to think about apps in a device-centric bubble. This blog explains how to make your UX more human-centric instead of device centric to create the best possible UX.

Building Augmented Reality Apps in five Steps

Augmented reality is really cool (and surprisingly easy). We outline how to create an augmented reality app in five steps. Take a look at the boat!

BUILD 14946 for PC and Mobile

In our latest build we’ve got customized precision touchpad experiences, separated screen time-out settings, updated Wi-Fi settings for PC and Mobile and an important note about a chance to automatic updates.

Announcing Windows 10 Insider Preview Build 14946 for PC and Mobile

IoT on Xbox One: Best for You Sample Fitness App

Best For You is a sample fitness UWP app focused on collecting data from a fictional IoT enabled yoga wear and presenting it to the user in a meaningful and helpful way on all of their devices to track health and progress of exercise. In this post, we will be focusing on the IoT side of the Universal Windows Platform as well as Azure IoT Hub and how they work together to create an end-to-end IoT solution.”

Also, the sample code is on GitHub. Click below to get started!

Narwhals (and AppURI Handlers)

‘Nuf said.


Download Visual Studio to get started!

The Windows team would love to hear your feedback.  Please keep the feedback coming using our Windows Developer UserVoice site. If you have a direct bug, please use the Windows Feedback tool built directly into Windows 10.

New Windows Store submission API capabilities

$
0
0

The Windows Store submission API was launched earlier this year, enabling you to automate app, IAP durables and consumables, and package flights publishing through a REST API. Using the submission API helps speed up publishing, automate release management and reduce publishing errors.

This month, the submission API added two new capabilities:

If you try the submission API and receive an access denied error, please use the Feedback option at the bottom right of the Dev Center dashboard and select Submission API for the feedback area to request access.

To get started, read the API documentation and samples. You can also use Windows Store analytics API, which retrieves analytics data for all the apps in your account also through a REST API.

Download Visual Studio to get started.

The Windows team would love to hear your feedback.  Please keep the feedback coming using our Windows Developer UserVoice site. If you have a direct bug, please use the Windows Feedback tool built directly into Windows 10.

Learning Arduino the fun way - Writing Games with Arduboy

$
0
0

IMG_1666My kids and I are always tinkering with gadgets and electronics. If you follow me on Instagram you'll notice our adventures as we've built a small Raspberry Pi powered arcade, explored retro-tech, built tiny robots, 3D printed a GameBoy (PiGrrl, in fact), and lots more.

While we've done a bunch of small projects with Arduinos, it's fair to say that there's a bit of a gap when one is getting started with Arduino. Arduinos aren't like Raspberry PIs. They don't typically have a screen or boot to a desktop. They are amazing, to be sure, but not everyone lights up when faced with a breadboard and a bunch of wires.

The Arduboy is a tiny, inexpensive hardware development platform based on Arduino. It's like a GameBoy that has an Arduino at its heart. It comes exactly as you see in the picture to the right. It uses a micro-USB cable (included) and has buttons, a very bright black and white OLED screen, and a speaker. Be aware, it's SMALL. Smaller than a GameBoy. This is a game that will fit in an 8 year old's pocket. It's definitely-fun sized and kid-sized. I could fit a half-dozen in my pocket.

The quick start for the Arduboy is quite clear. My 8 year old and I were able to get Hello World running in about 10 minutes. Just follow the guide and be sure to paste in the custom Board Manager URL to enable support in the IDE for "Arduboy."

The Arduboy is just like any other Arduino in that it shows up as a COM port on your Windows machine. You use the same free Arduino IDE to program it, and you utilize the very convenient Arduboy libraries to access sound, draw on the screen, and interact with the buttons.

To be clear, I have no relationship with the Arduboy folks, I just think it's a killer product. You can order an Arduboy for US$49 directly from their website. It's available in 5 colors and has these specs:

Specs

  • Processor: ATmega32u4 (same as Arduino Leonardo & Micro)
  • Memory: 32KB Flash, 2.5KB RAM, 1KB EEPROM
  • Connectivity: USB 2.0 w/ built in HID profile
  • Inputs: 6 momentary tactile buttons
  • Outputs: 128x64 1Bit OLED, 2 Ch. Piezo Speaker & Blinky LED
  • Battery: 180 mAh Thin-Film Lithium Polymer
  • Programming: Arduino IDE, GCC & AVRDude

There's also a friendly little app called Arduboy Manager that connects to an online repository of nearly 50 games and quickly installs them. This proved easier for my 8 year old than downloading the source, compiling, and uploading each time he wanted to try a new game.

The best part about Arduboy is its growing community. There's dozens if not hundreds of people learning how to program and creating games. Even if you don't want to program one, the list of fun games is growing every day.

The games are all open source and you can read the code while you play them. As an example, there's a little game called CrazyKart and the author says it's their first game! The code is on GitHub. Just clone it (or download a zip file) and open the .ino file into your Arduino IDE.

Arduboys are easy to program

Because the Arduboy is so constrained, it's a nice foray into game development for little ones - or any one. The screen is just 128x64 and most games use sprites consisting of 1 bit (just black or white). The Arduboy library is, of course, also open source and includes the primitives that most games will need, as well as lots of examples. You can draw bitmaps, swap frames, draw shapes, and draw characters.

We've found the Arduboy to be an ideal on ramp for the kids to make little games and learn basic programming. It's a bonus that they can easily take their games with them and share with their friends.

Related Links


Sponsor: Thanks to Redgate this week! Discover the world’s most trusted SQL Server comparison tool. Enjoy a free trial of SQL Compare, the industry standard for comparing and deploying SQL Server schemas.


© 2016 Scott Hanselman. All rights reserved.
     
Viewing all 10804 articles
Browse latest View live


<script src="https://jsc.adskeeper.com/r/s/rssing.com.1596347.js" async> </script>